Chapter 7. Appearance of CloudConnect Perspective
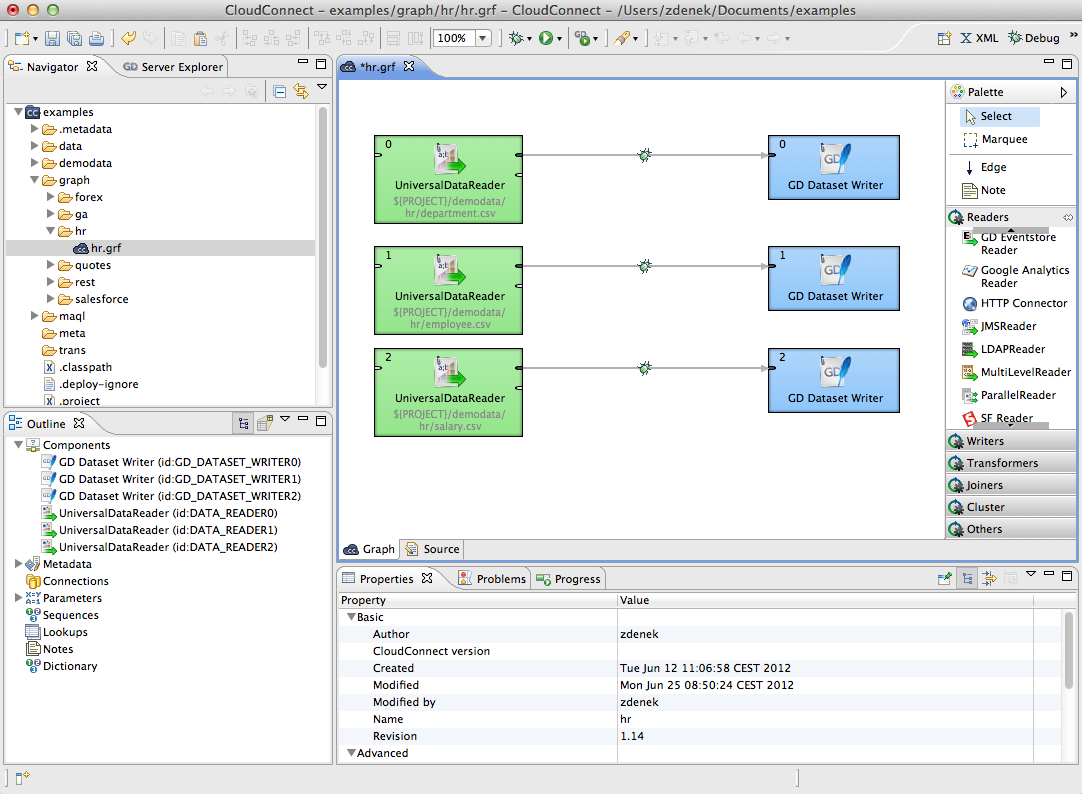
The CloudConnect perspective consists of 4 panes:
Graph Editor with Palette of Components is in the upper right part of the window.
In this pane you can create your graphs. Palette of Components serves to select components, move them into the Graph Editor, connect them by edges. This pane has two tabs. (See Graph Editor with Palette of Components.)
Navigator & Server Explorer pane is in the upper left part of the window.
There are folders and files of your projects in the Navigator tab. You can expand or collapse them and open any graph by double-clicking its item. (See Navigator Pane.)
The Server Explorer tab contains the hierarchical list of all GoodData platform projects and deployed ETL graphs (see Server Explorer Tab.)
Outline pane is in the lower left part of the window.
There are all of the parts of the graph that is opened in the Graph Editor. (See Outline Pane.)
Tabs pane is in the lower right part of the window.
You can see the data parsing process in these tabs. (See Tabs Pane.)
