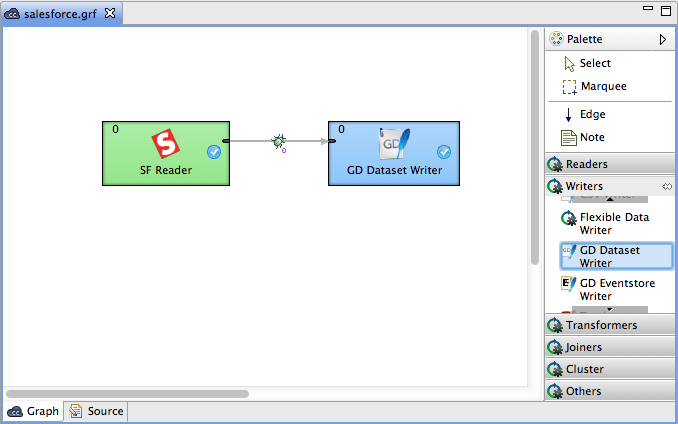
Graph Editor with Palette of Components
The most important pane is the Graph Editor with Palette of Components.
To create a graph, you need to work with the Palette tool. It is either opened after CloudConnect Designer has been started or you can open it by clicking the arrow which is located above the Palette label or by holding the cursor on the Palette label. You can close the Palette again by clicking the same arrow or even by simple moving the cursor outside the Palette tool. You can even change the shape of the Palette by shifting its border in the Graph Editor and/or move it to the left side of the Graph Editor by clicking the label and moving it to this location.
The name of the user that has created the graph and the name of its last modifier are saved to the Source tab automatically.
It is the Palette tool from which you can select a component and paste it to the Graph Editor. To paste the component, you only need to click the component label, move the cursor to the Graph Editor and click again. After that, the component appears in the Graph Editor. You can do the same with the other components.
Once you have selected and pasted more components to the Graph Editor, you need to connect them by edges taken from the same Palette tool. To connect two components by an edge, you must click the edge label in the Palette tool, move the cursor to the first component, connect the edge to the output port of the component by clicking and move the cursor to the input of another component and click again. This way the two components will be connected. Once you have terminated your work with edges, you must click the item in the Palette window.
After creating or modifying a graph, you must save it by selecting the item from the context menu or by clicking the button in the main menu. The graph becomes a part of the project in which it has been created. A new graph name appears in the Navigator pane. All components and properties of the graph can be seen in the Outline pane when the graph is opened in the Graph Editor.
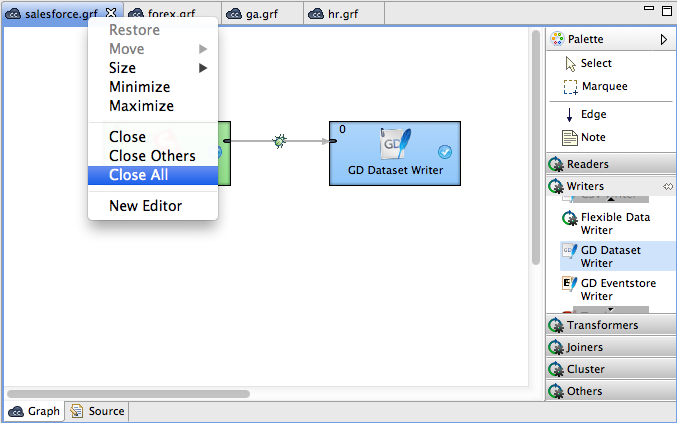
If you want to close any of the graphs that are opened in the Graph Editor, you can click the cross at the right side of the tab, but if you want to close more tabs at once, right-click any of the tabs and select a corresponding item from the context menu. There you have the items: Close, Close other, Close All and some other ones. See below:
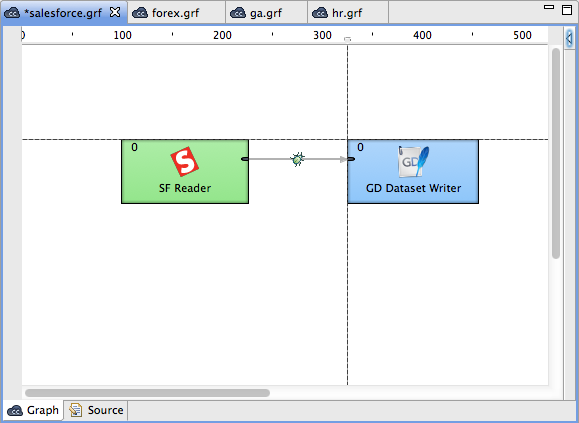
From the main menu, you can select the item (but only when the Graph Editor is highlighted) and you can turn on the option from the menu items.
After that, as you click anywhere in the horizontal or vertical rulers, there appear vertical or horizontal lines, respectively. Then, you can push any component to some of the lines and once the component is pushed to it by any of its sides, you can move the component by moving the line. When you click any line in the ruler, it can be moved throughout the Graph Editor pane. This way, you can align the components.
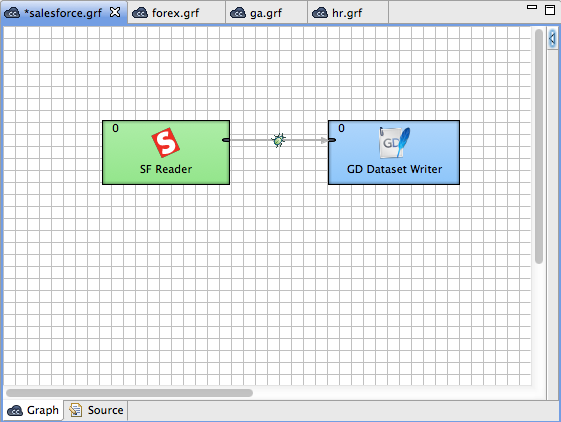
From the main menu, you can also select the item (but only when the Graph Editor is highlighted) and you can display a grid in the Graph Editor by selecting the item from the main menu.
After that, you can use the grid to align the components as well. As you move them, the components are pushed to the lines of the grid by their upper and left sides. This way, you can align the components too.
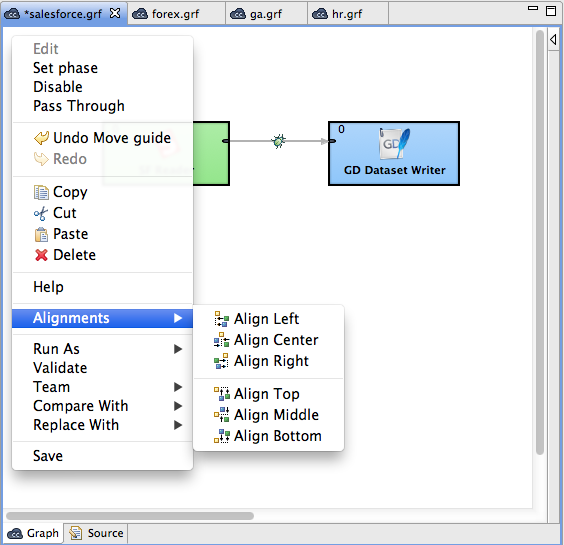
Another possibility of what you can do with the Graph Editor is the following:
When you push and hold down the left mouse button somewhere inside the Graph Editor, drag the mouse throughout the pane, a rectangle is created. When you create this rectangle in such a way so as to surround some of the graph components and finally release the mouse button, you can see that these components have become highlighted. After that, right clicking anywhere in the Graph Editor and selecting the allows you to align the selected components (, , , , and ). See below:
Remember that you can copy any highlighted part of any graph by pressing Ctrl+C and subsequently Ctrl+V after opening some other graph.