Chapter 9. Running CloudConnect Graphs
As was already mentioned, in addition to the context menu from which you can run graphs, you can run them from other places. There are four simplest ways of running a graph:
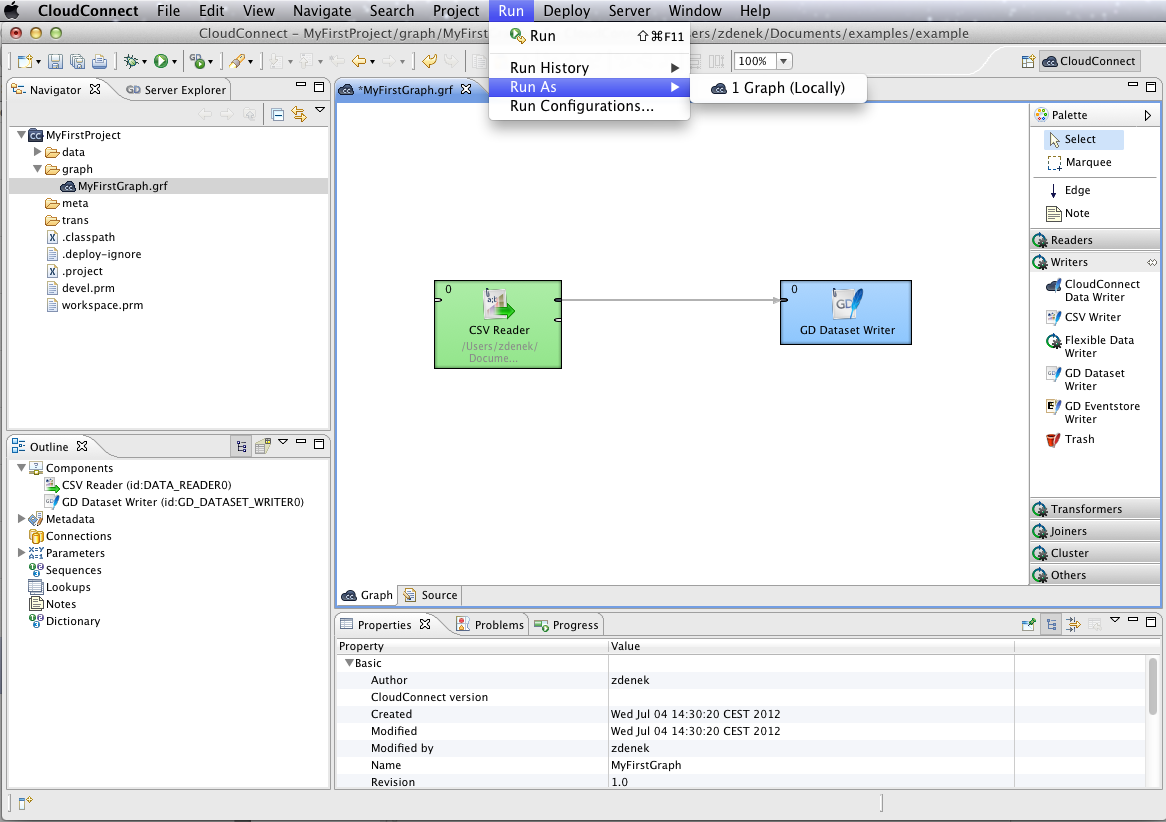
You can select → → from the main menu.
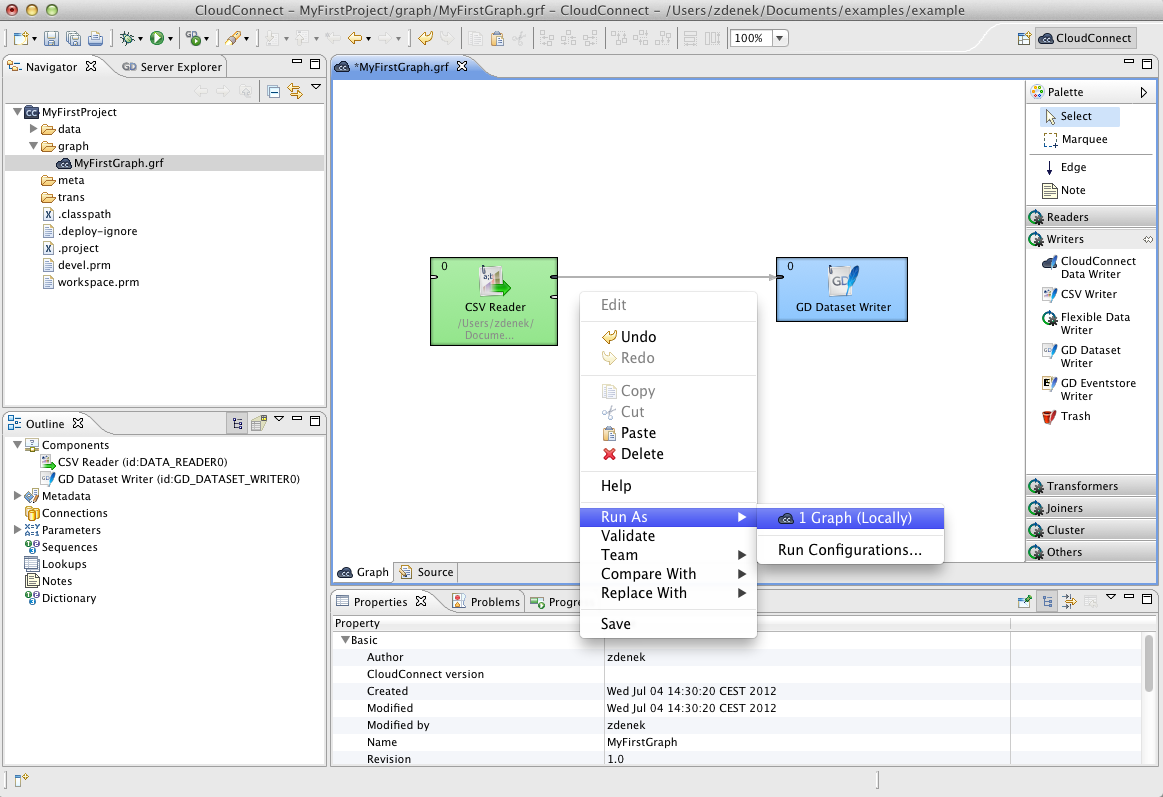
Or you can right-click in the , then select in the context menu and click the item.
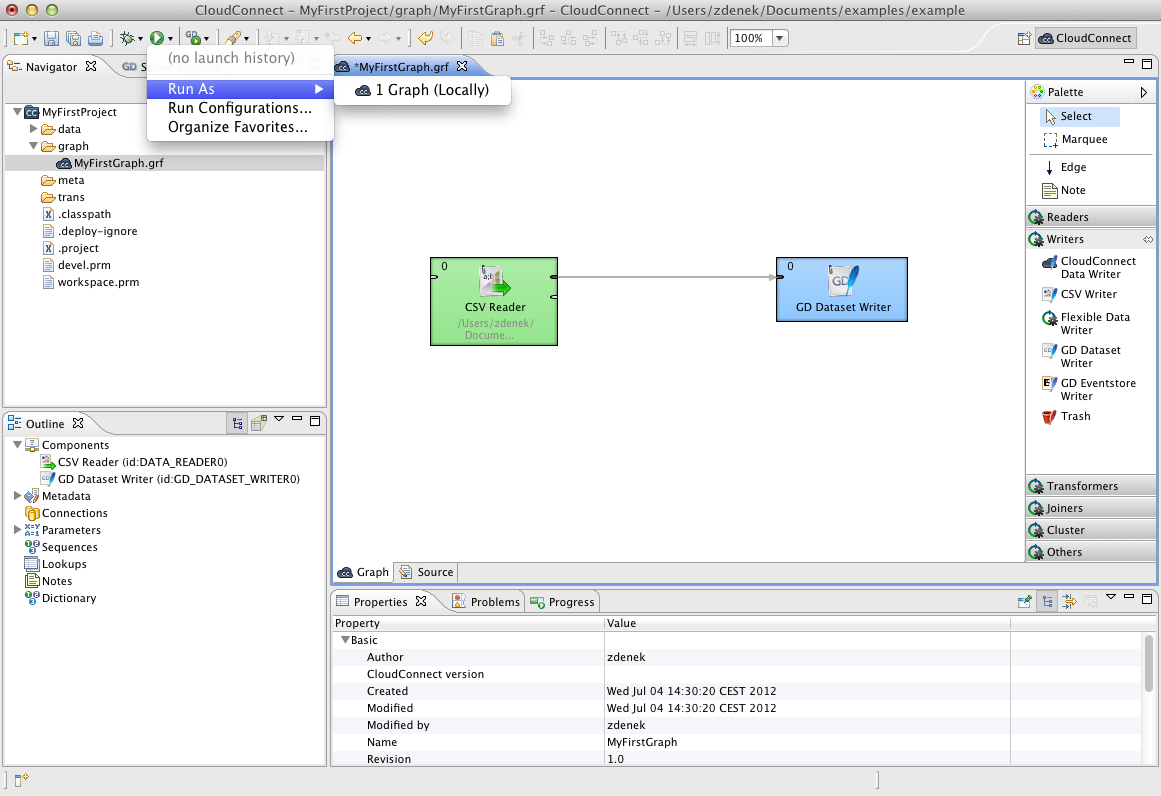
Or you can click the green circle with white triangle in the toolbar located in the upper part of the window.
Successful Graph Execution
After running any graph, the process of the graph execution can be seen in the Console and the other tabs. (See Tabs Pane for detailed information.)
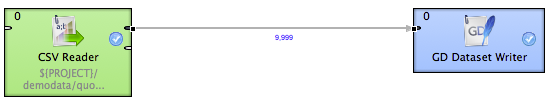
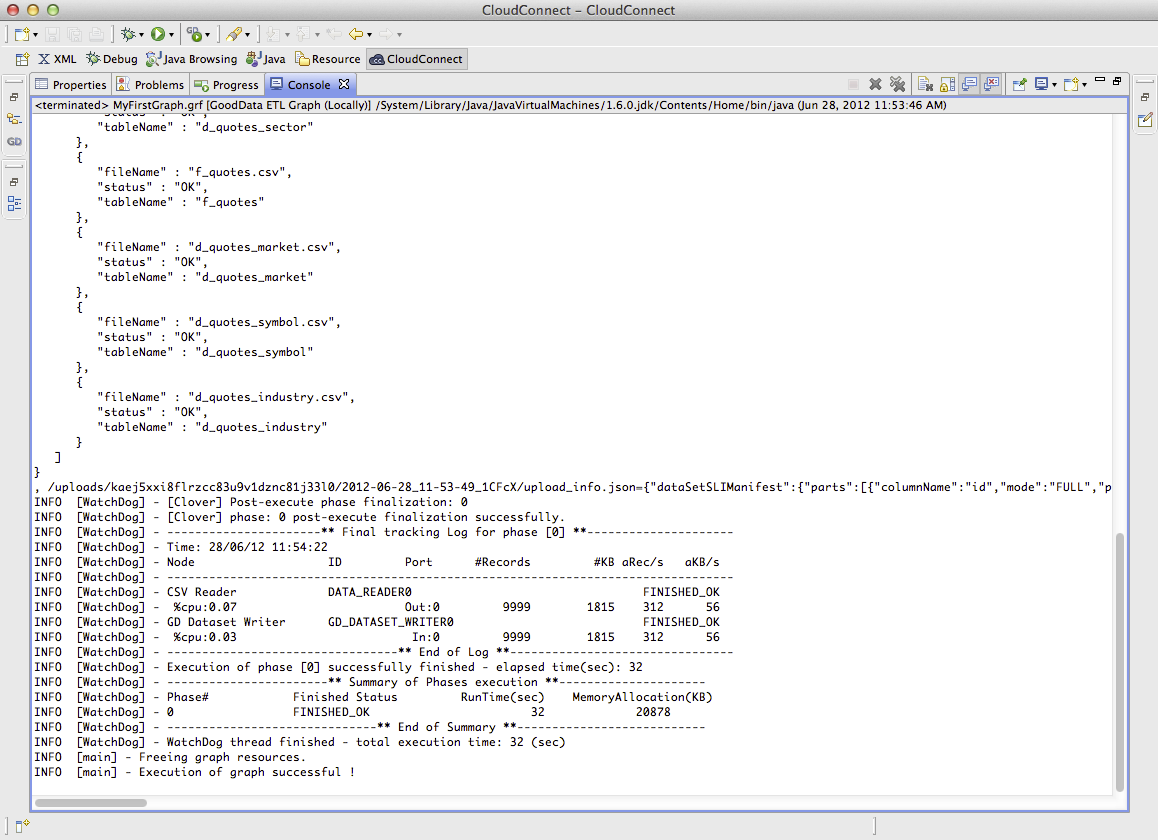
And, below the edges, counts of processed data should appear:
Using the Run Configurations Dialog
In addition to the options mentioned above, you can also open the Run Configurations dialog, fill in the project name, the graph name and set up program and vm arguments, parameters, etc. and click the button.
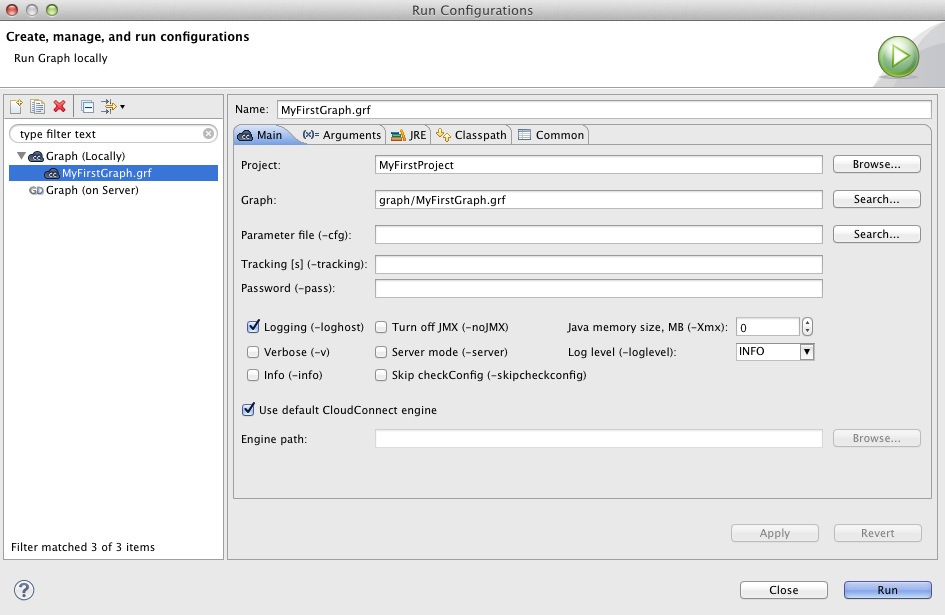
More details about using the Run Configurations dialog can be found in Chapter 25, Advanced Topics.