Creating a Simple Graph in a Few Simple Steps
After creating a new CloudConnect graph, it is an empty pane. In order to create a non-empty graph, you must fill the empty graph with components and other graph elements. You need to select graph components, set up their properties (attributes), connect these components by edges, select data files and/or database tables that should be read or unloaded from, written or loaded to, create metadata describing data, assign them to edges, create database connections or JMS connections, create lookup tables and/or create sequences and parameters. Once all of it is done, you can run the graph.
If you want to know what edges, metadata, connections, lookup tables, sequences or parameters are, see Part VIII, Graph Elements, Structures and Tools for information.
Now we will present you a simple example of how CloudConnect transformation graphs can be created using CloudConnect Designer. We will try to make the explanation as clear as possible.
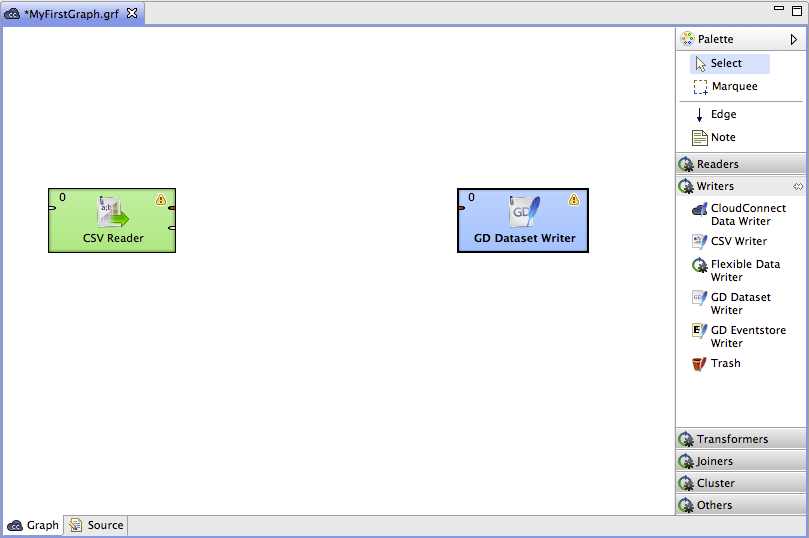
First, you need to select components from the Palette of Components.
To select any component, click the triangle on the upper right corner of the Graph Editor pane. The Palette of Components will open. Select the components you want by clicking and then drag-and-dropping them to the Graph Editor pane.
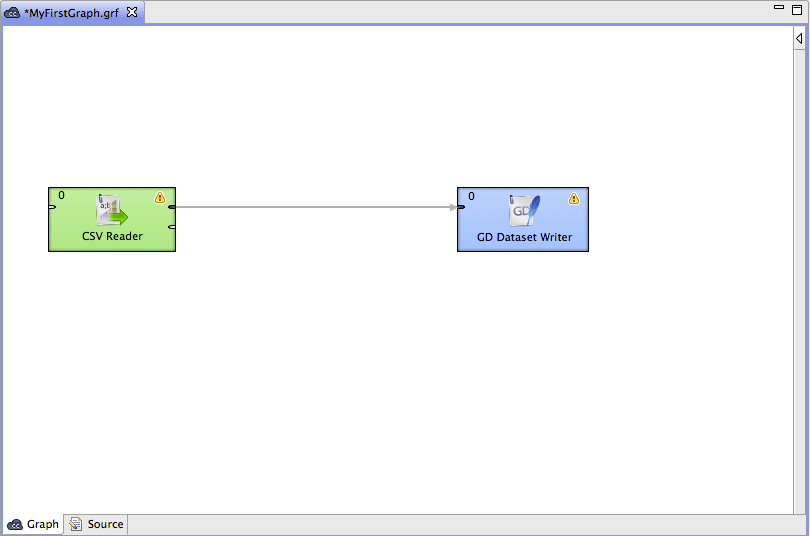
For our demonstration purposes, select CSVReader from the Readers category of the Palette. Select also the GD Dataset Writer component from the Writers category.
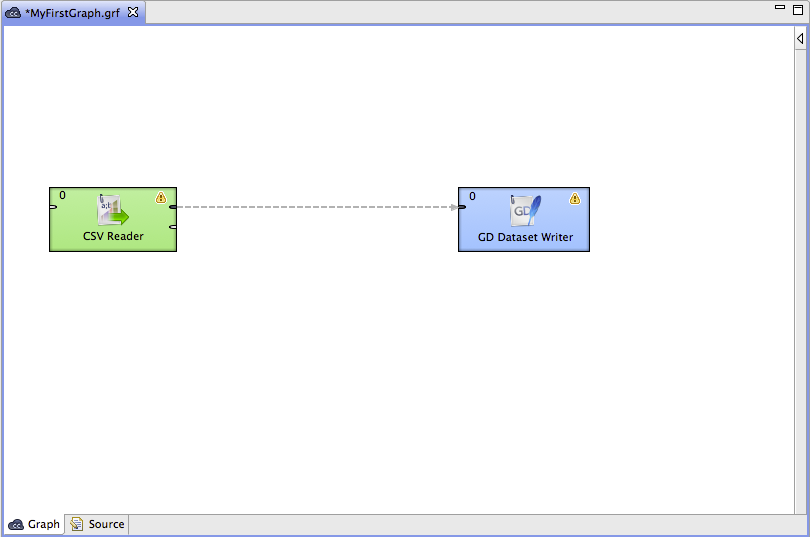
Once you have inserted the components to the Graph Editor pane, you need to connect them by edges. Select the Edge tool on the Palette and click the output port of one component and connect it with the input port of another by clicking again. The newly connected edges are still dashed. Close the Palette by clicking the triangle at its upper right corner. (See Chapter 27, Edges for more information about Edges.)
Now right-click the edge and select → from the pop-up menu that appears beside the edge.
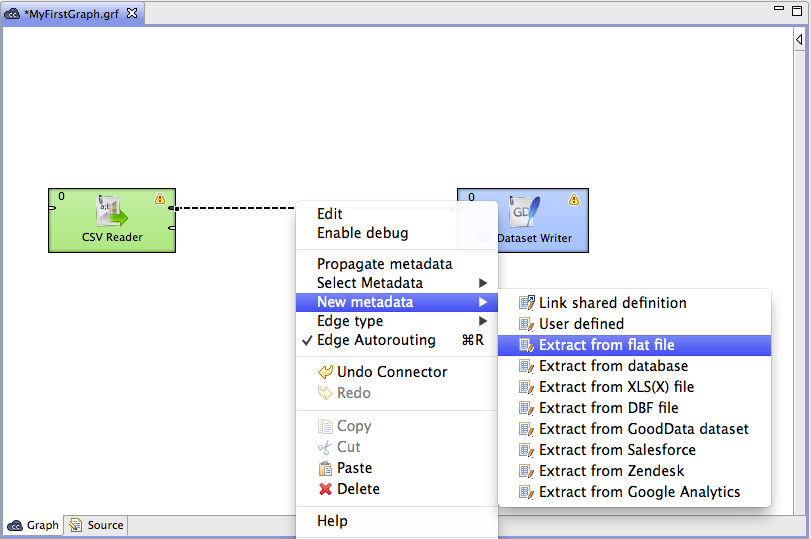
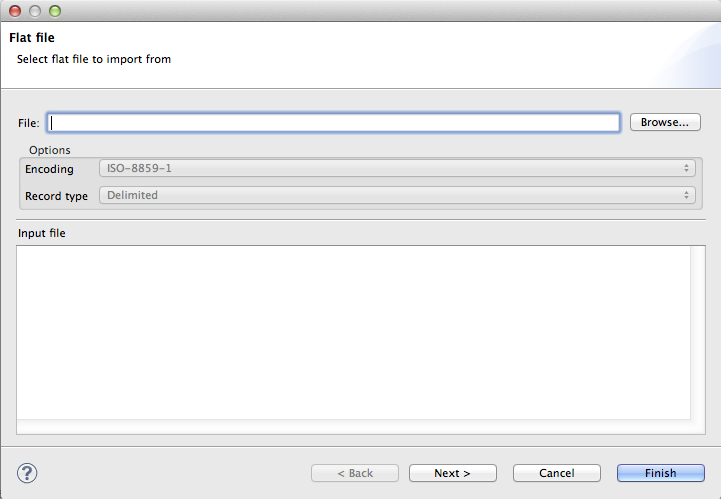
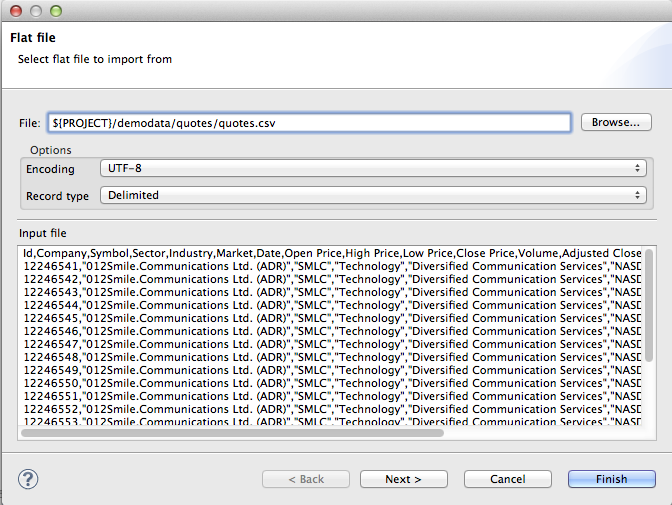
The Flat file dialog appears.
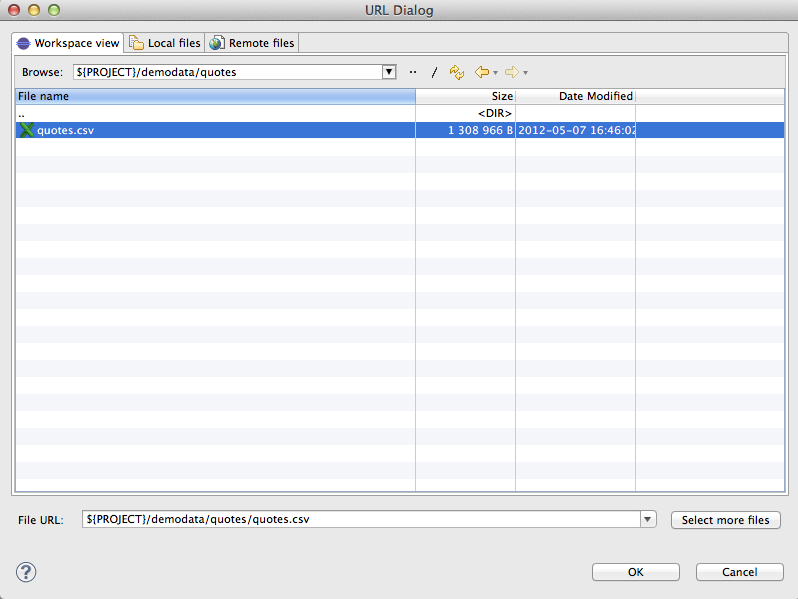
Click on the button and select the quotes.csv from the demodata/quotes directory in the Workspace view tab of the URL Dialog that pops up.
Then select the UTF-8 encoding and the Delimited record type in the Flat file dialog and click on the button.
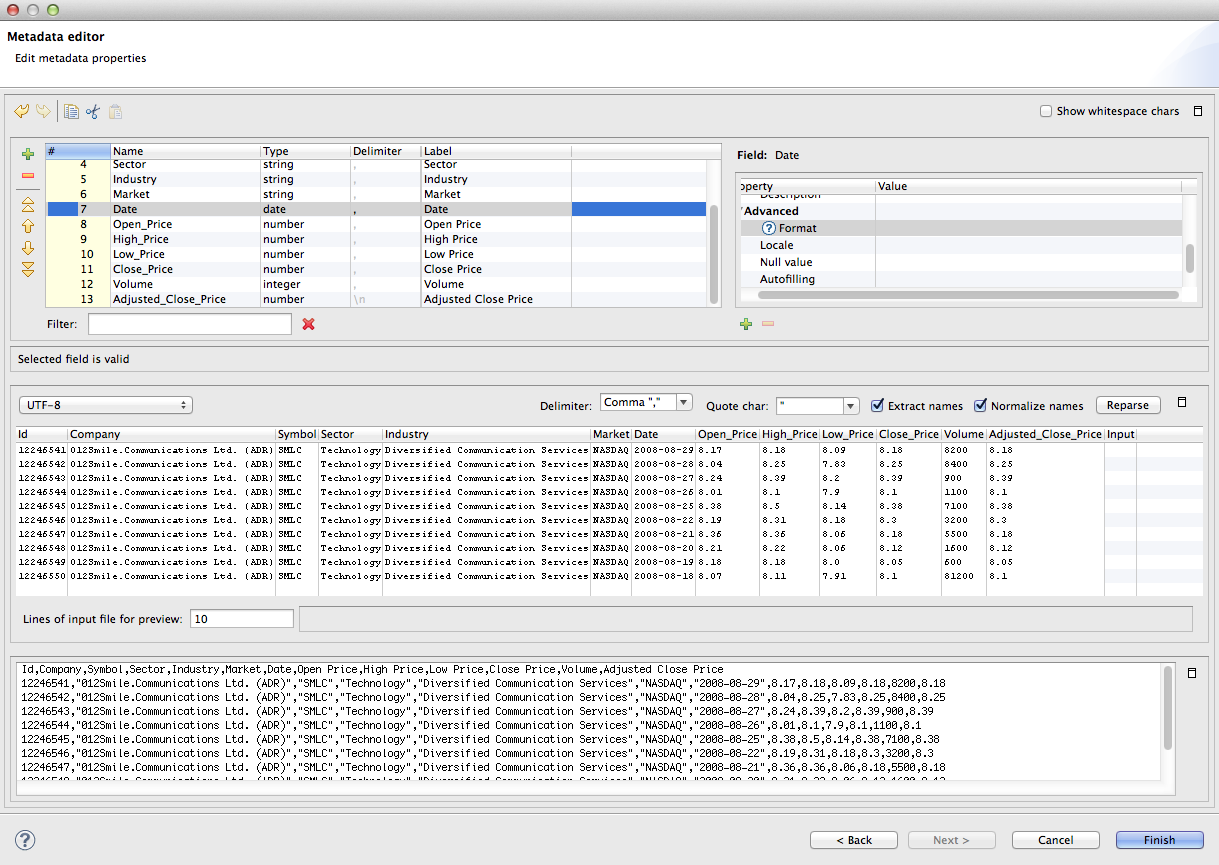
The Metadata editor appears. The Designer parses the CSV file and guesses the file metadata. Then select the double-quote character in the Quote char listbox, make sure that both Extract names and Normalize names checkboxes are checked and click on the button. The field data types should be now guessed. Now double-check that all _Price fields are numbers. Change the type of the Date field to date. Change the type of the Volume field to long and type of the Id field to string.
After clicking , metadata is created and assigned to the edge. The edge is solid now.
Now, double-click CSVReader, click the File URL attribute row and click the ... button that appears at the end of the edit line.
(You can see CSVReader for more information about CSVReader.)
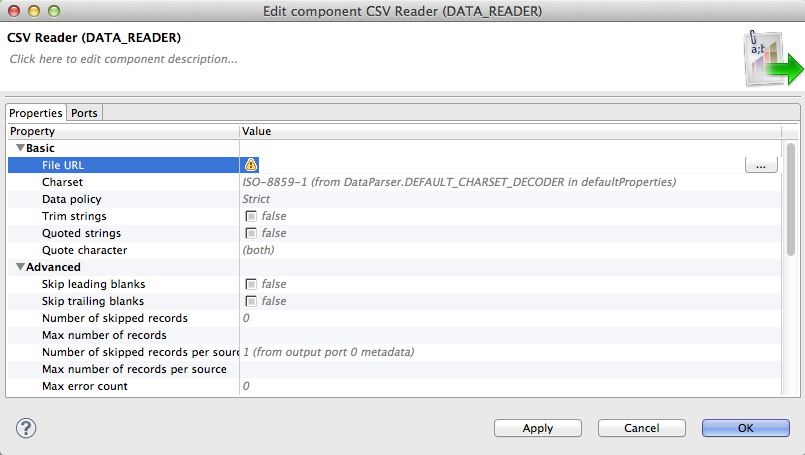
After that, URL File Dialog will open. Select the demodata/quotes/quotes.csv file again.
Then check the Quoted strings option, set the Charset to UTF-8, Quote character to double-quote and Number of skipped records to 1. Then click . The parameters should look like this:
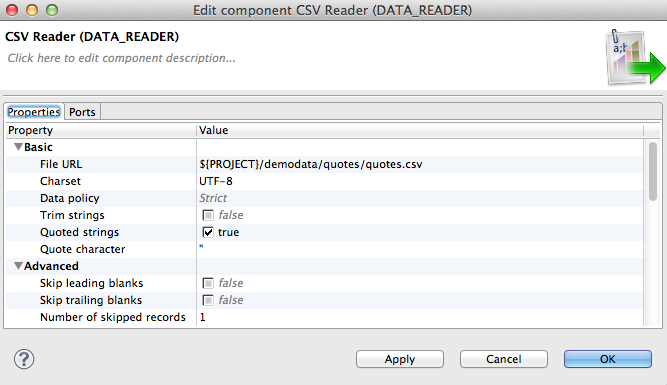
Click to close the CSVReader editor.
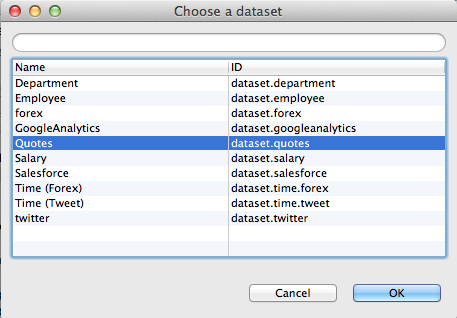
Now we configure the GD Dataset Writer component. Double-click on it, point the cursor to the Data set property text field and click on the button at the end of the text field. Select the Quotes dataset in the Choose a dataset popup dialog.
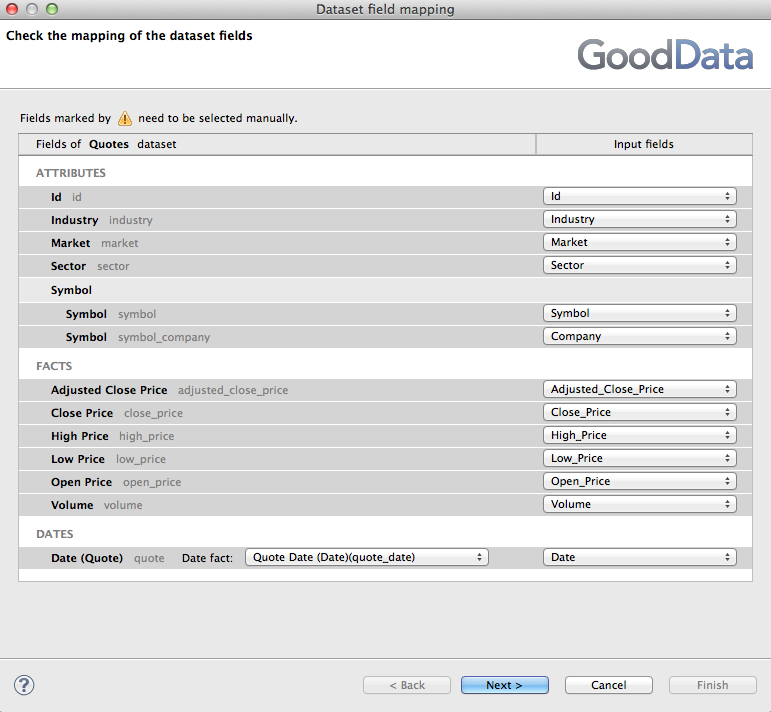
Now configure the Field mapping property that maps the input edge metadata fields to the GoodData dataset structure. Click on the button at the end of the Field mapping editor. The dialog that pops up contains the dataset attributes, facts and references on the left and the input metadata fields on the right. Most of the field should be correctly pre-selected. Configure the dialog according to the figure below and click the button.
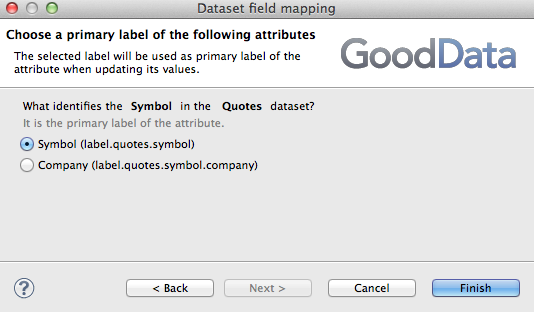
Then select the Symbol field as the identifier of the Symbol attribute and click the Finish button.
Click to close the GD Dataset Writer editor and save the graph by pressing Ctrl+S .
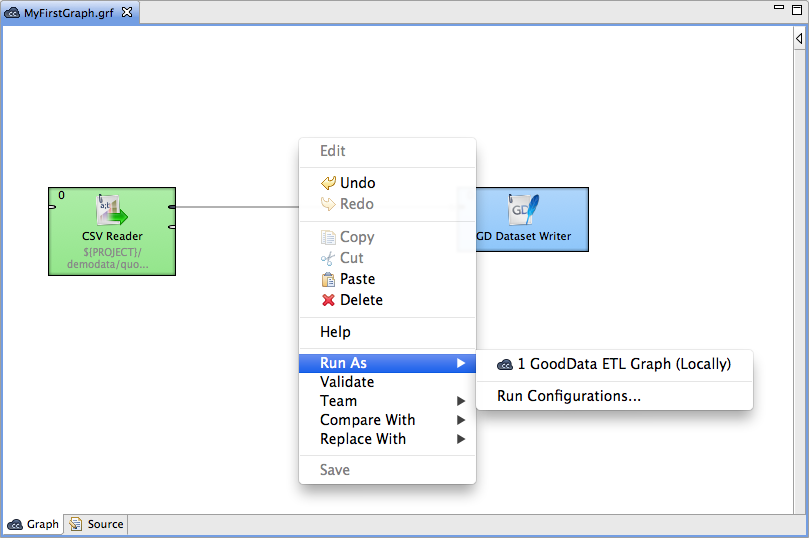
Now right-click in any place of the Graph Editor (outside any component or edge) and select → .
(Ways how graphs can be run are described in Chapter 9, Running CloudConnect Graphs.)
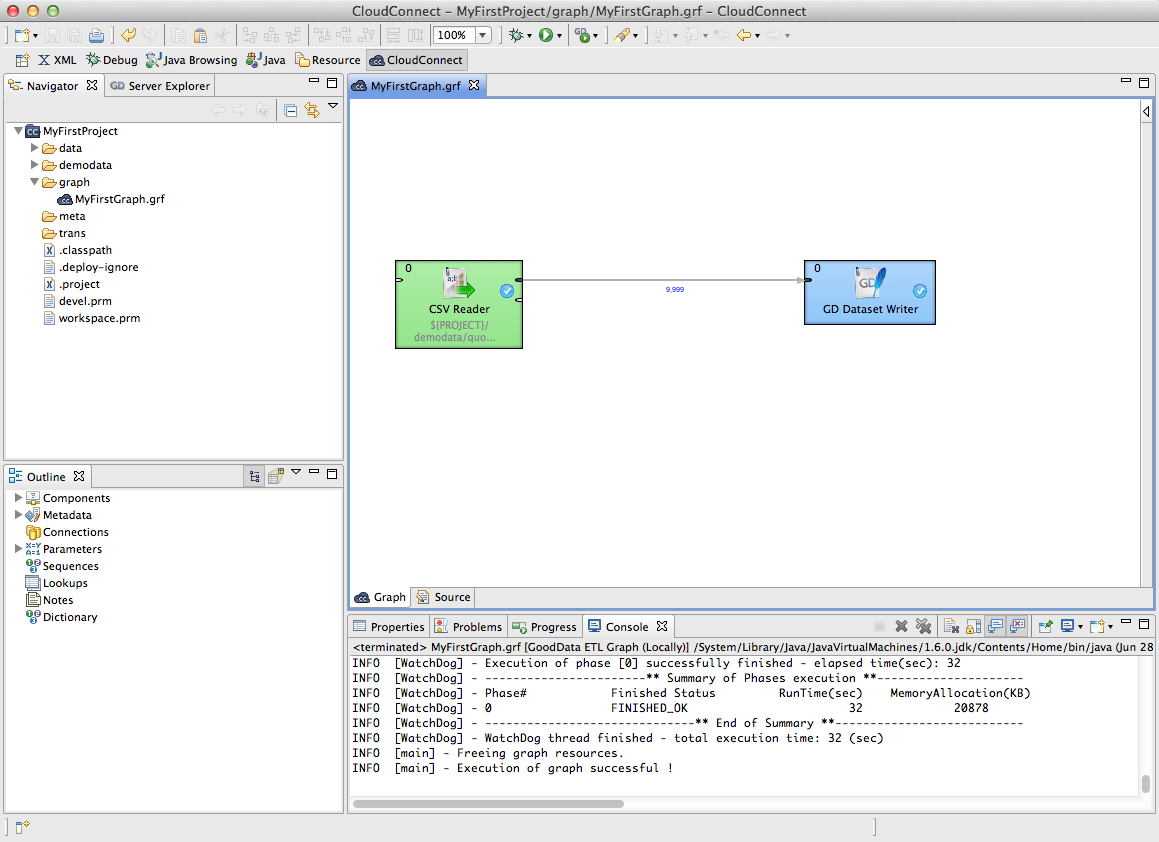
Once graph runs successfully, blue circles are displayed on the components and numbers of parsed records can be seen below the edges: