Preparing a Data Loading Process
This topic is part of the tutorial that is intended for developers who plan to work on data models and ETL using CloudConnect.
If you are interested in creating reports, dashboards, or metrics, start with [Reporting and Dashboards]{.ul}.
CloudConnect is a legacy tool and will be discontinued. We recommend that to prepare your data you use the GoodData data pipeline as described in Data Preparation and Distribution. For data modeling, see Data Modeling in GoodData to learn how to work with Logical Data Modeler.
An ETL (Extract - Transform - Load) graph is a series of steps used to pull data from a source, transform it into an appropriate format, and load it into the GoodData platform.
You create an ETL graph in CloudConnect as a sequence of visual objects. You can set up them to gather data from nearly any enterprise source database, platform, messaging service, or file system.
A CloudConnect project can contain one or more ETL graphs. ETL graphs are stored in the GRF files under the ‘graph’ directory. CloudConnect provides a suite of pre-built components to manipulate data. You can also write custom transform functions.
Demo ETL Graph
When executed, the ETL graph in this demo project accesses Twitter, downloads recent tweets mentioning GoodData, parses those tweets, and uploads that information into your GoodData project.
In CloudConnect, double-click the twitter.grf file.
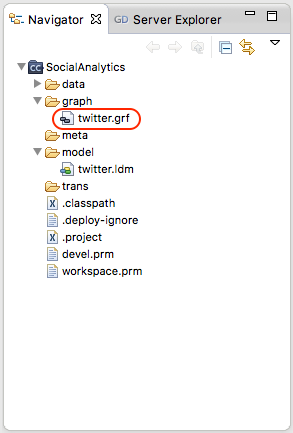
The demo logical data model opens in the CloudConnect Designer panel. The following picture shows the demo ETL graph:
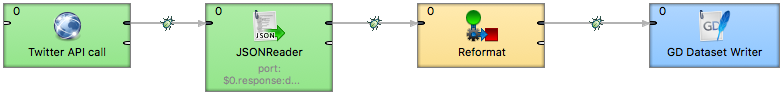
This graph completes a linear process containing the following steps in order:
Sequence | LDM Component | Description |
|---|---|---|
1 | Twitter API Call | Reads directly from the Twitter API to extract tweets that contain the value “gooddata”. The Twitter API Call component is a modified version of the REST Connector component. See REST Connector. |
2 | JSONReader | Converts the JSON stream received from the Twitter API component into XML, as defined by the transformation in the Mapping field. |
3 | Reformat | Converts the XML data to the internal data types, per the logical data model. For example, the text string for the Retweets value is converted to an integer, so that it can be used as a fact in the contribution of a metric. These reformatting changes are defined as transformations in this component. See Reformat Component. |
4 | GD Dataset Writer | Loads cleaned GoodData-formatted data into the corresponding tables in the GoodData database. See GD Dataset Writer Component. |
When writing data to GoodData, each dataset in the target project requires its own GD Dataset Writer component. This requirement does not apply to Date datasets.
Enable Debugging
Before publishing the graph to a live project, we recommend that you first run a graph on your local computer to test the configuration and functionality.
In this demo graph, debugging is enabled in the component connections. Connections configured for debugging are marked with a bug icon: ![]()
Run Graphs Locally
Running an ETL graph locally does not push data to the remote GoodData project.
Steps:
- Click the Server Explorer tab. A list of your available projects is displayed in the bottom pane.
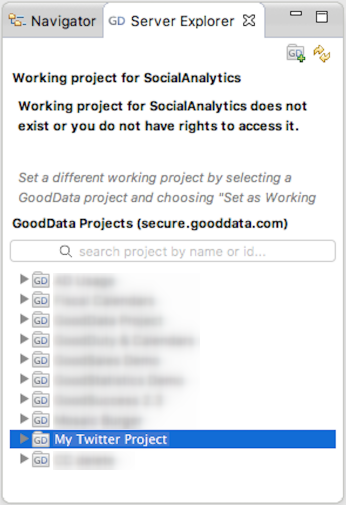
- Right-click My Twitter Project, and select Set as Working Project. The project is updated with a new icon to indicate that it is the working project.
- Right-click anywhere in the Editor pane, and select Run As -> 1 Graph (Locally). As the process runs, the CloudConnect Console window displays a real-time log of CloudConnect activity. If all steps are processed correctly, the console log displays an “Execution of graph successful” message.
Review Uploaded Records
Review the count of the records processed between each two components in the ETL graph.
You can review the uploaded records only if you have enabled Debug mode.
Steps:
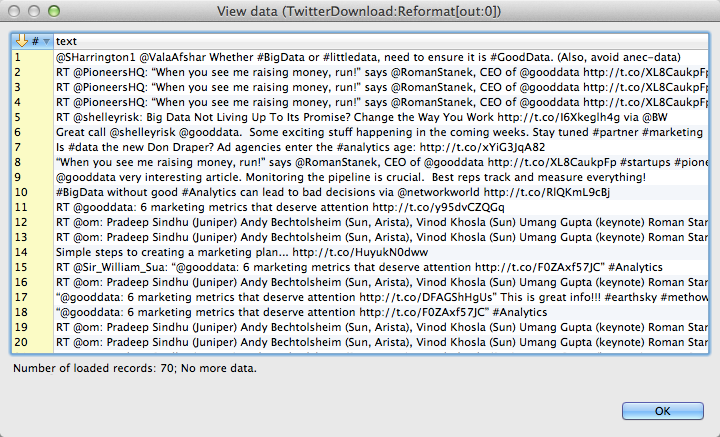
- Right-click the bug icon in a connection, and select View Data. The View data dialog opens.
- Un-select the Truncate Strings and Byte Arrays check box.
- Click OK. The list of records is generated.
Deploy the Graph to the GoodData Legacy
When you tested the graph locally, publish it to your GoodData project on the GoodData platform.
Steps:
- Click the Server Explorer tab, and select the twitter.grf file.
- In the toolbar, click the GD icon:

- From the dropdown, click Deploy to GoodData Server.
- Select My Twitter Project, and click Deploy. The ETL graph is published to the selected GoodData project.