Setting up Events for Drilling in Embedded Analytical Designer and Dashboards
GoodData portal supports several types of drilling:
- You can configure reports so that when you click them, the reports drill to other reports, dashboards, or attributes. (For more information, see Drilling into Reports.)
- In the embedded mode, you can set a drill event and integrate GoodData with a parent application. You can then drill from reports and insights directly to records outside of GoodData.
This article describes drill events and how they work on embedded dashboards and in Analytical Designer.
In GoodData, terms workspace and project denote the same entity.
Drillable Items
On embedded dashboards and Analytical Designer, you can use postMessages to send a list of all facts, metrics, and attributes that you want to be drillable for each insight, i.e. that you want to interact with your application.
Drillable items are then highlighted and clickable. You can then capture the events these facts, metrics, and attributes fire and use them outside of the GoodData portal.
Enabling Drilling
In your application, embed a dashboard or Analytical Designer. For more information, see Embed a Dashboardand Embed Analytical Designer.
Add an event listener to the main windows object in your application and register the following:
window.addEventListener('message', function(arg) { console.log(arg.data); });When the dashboard or Analytical Designer loads, it sends a
listeningForDrillableItemspostMessage to your application.{ "gdc": { "product": "dashboard", // or "analyticalDesigner" "event": { "name": "listeningForDrillableItems" } } }Your application sends back the list of URIs and/or identifiers of all fact, metric, and attribute display forms that should be drillable. The list must have the following format:
{
    "gdc": {
        "product": "analyticalDesigner", // or "dashboard",
        "event": {
            "name": "drillableItems",
            "data": {
                "uris": [
                    "/gdc/md/{projectHash}/obj/9211",
                    "/gdc/md/{projectHash}/obj/9212",
                    "/gdc/md/{projectHash}/obj/9213"
                ],
                "identifiers": [
                    "aaeb7jTCfexV",
                    "bbfc8kSDgfyW"
                ],
                "composedFrom": {
                    "uris": [
                        "/gdc/md/{projectHash}/obj/9214"
                    ],
                    "identifiers": [
                        "dugc2PfRgleE"
                    ],
                }
            ]
        }
    }
}
All properties of the
dataentry are optional.You can use both display form URIs and identifiers to activate drilling.
If a URI or an identifier from the list cannot be found on the dashboard or is invalid, this item is ignored.
If a fact/metric/attribute from the list does not become drillable, verify that their URI/identifier is correct.
See also the How to Display Metric and Attribute URIs and Identifiers section.
ThecomposedFrom.urisandcomposedFrom.identifiersproperties activate drilling for metric created directly in Analytical Designer. Every identifier or uri in this property activates and every metric created from them is activated for drilling as well. For details about creating metrics, see Create Metrics in Insights.To customize actions that happen when users click on a drillable item, follow instructions in the Capturing Events Sent from GoodData section.
See Drill Eventing versus Drill into Dashboard for additional details.
How to Display Metric and Attribute URIs and Identifiers
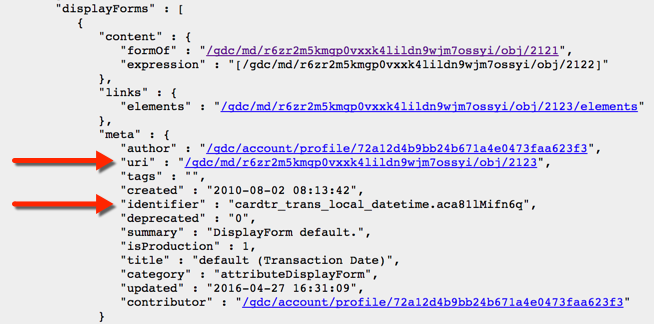
You can display the URI or identifier of each fact, metric, or attribute on the GoodData portal grey pages:
- In your browser, go to: For facts and metrics:
https://{domain name}/gdc/md/{PROJECT_ID}/query/metricsFor attributes:https://{domain name}/gdc/md/{PROJECT_ID}/query/attributesNote: Project ID is a different name for Workspace ID. See Find the Workspace ID. - Click the fact/metric/attribute whose identifier/URI you want to display.
- In the displayForms section, copy the display form identifier/URI.
Capturing Events Sent from GoodData
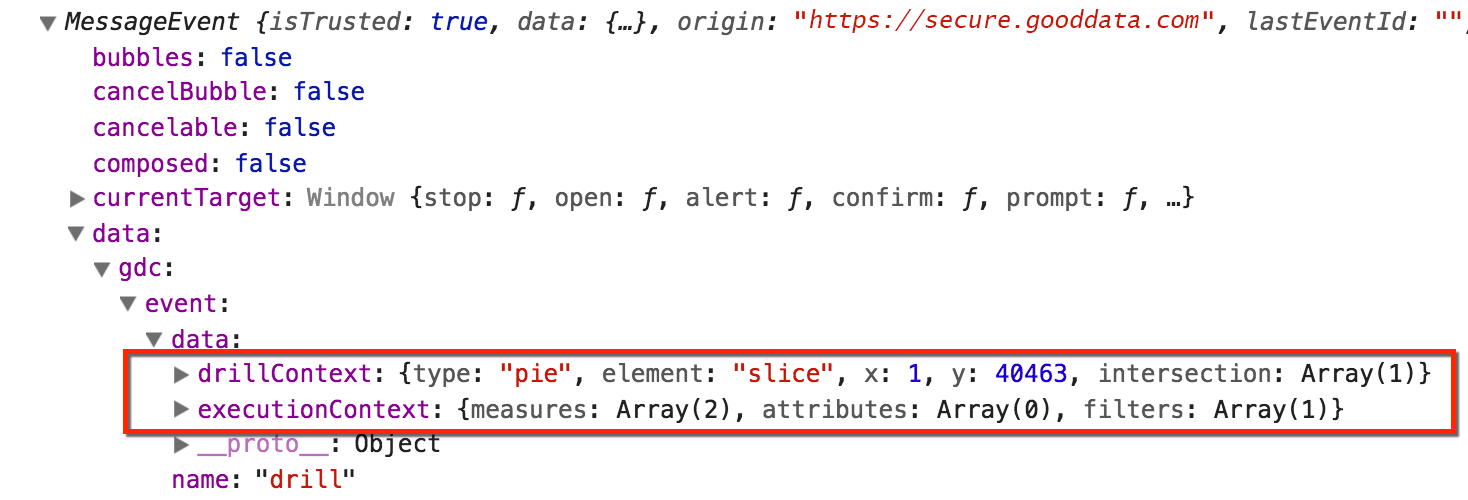
When a user clicks on a KPI/insight that is listed as a drillable item, a postMessage is sent to your application containing the following information:
- The
executionContextidentifies the KPI/insight and is the same wherever in the KPI/insight users click. - The
drillContextidentifies the exact place where users click in an insight. It includes information about chart type, values, and so on. - The
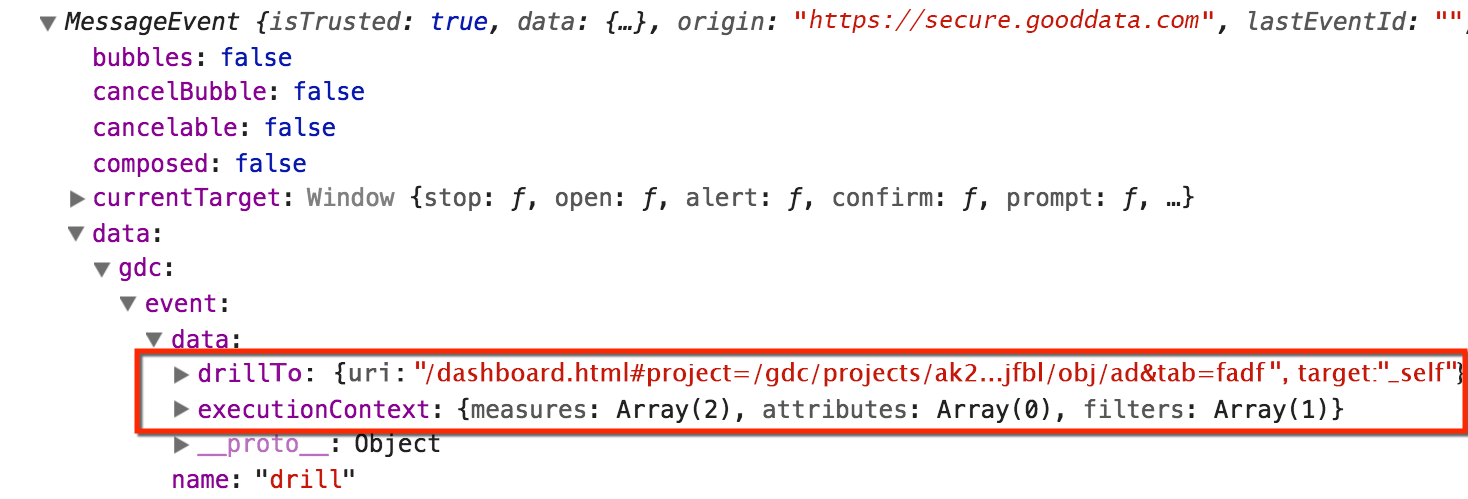
drillToidentifies the KPI’s Drill into dashboard settings. For more information, see Drill Eventing versus Drill into Dashboard below.
To display the executionContext, drillContext and drillTo :
- Add an event listener to your application. See step 2 in section Enabling Drilling.
- Open the browser developer tools.
- Click on an insight.
In the event listener in the MessageEvent section, search for the captured event executionContext, and drillContext,and drillTo details in data.gdc.event.data.
Metrics created directly in Analytical Designer are not stored in the Data Catalog and therefore they do not have uris or identifier. Drill events fired by clicking on such metrics include only id and title, not the header object.
For details about metrics, see Create Metrics in Insights.
 "executionContext": {
  "measures": [{
        "localIdentifier": "m1",
        "definition": {
            "measure": {
                "item": {
                    "uri": "/gdc/md/a1bc2defghi3jk4lmno56pqr7s8t9uvw/obj/9211"
                }
            }
        }
    }],
    "attributes": [{
            "localIdentifier": "a1",
            "displayForm": {
                "uri": "/gdc/md/a1bc2defghi3jk4lmno56pqr7s8t9uvw/obj/1027"
            }
        },
        {
            "localIdentifier": "a2",
            "displayForm": {
                "uri": "/gdc/md/a1bc2defghi3jk4lmno56pqr7s8t9uvw/obj/952"
            }
        }
    ],
    "filters": [{
        "negativeAttributeFilter": {
            "displayForm": {
                "uri": "/gdc/md/a1bc2defghi3jk4lmno56pqr7s8t9uvw/obj/952"
            },
            "notIn": [
                "/gdc/md/a1bc2defghi3jk4lmno56pqr7s8t9uvw/obj/951/elements?id=1",
                "/gdc/md/a1bc2defghi3jk4lmno56pqr7s8t9uvw/obj/951/elements?id=2",
                "/gdc/md/a1bc2defghi3jk4lmno56pqr7s8t9uvw/obj/951/elements?id=3",
                "/gdc/md/a1bc2defghi3jk4lmno56pqr7s8t9uvw/obj/951/elements?id=4"
      ]
    }
  ]
}

"drillContext": {
  "type": "pie",
  "element": "slice",
  "x": 1,
  "y": 40463,
  "intersection": [
    {
      "id": "1226",
      "title": "Direct Sales",
      "header": {
        "uri": "\/gdc\/md\/a1bc2defghi3jk4lmno56pqr7s8t9uvw\/obj\/1027",
        "identifier": "label.owner.department"
      }
    },
    {
      "id": "965523",
      "title": "WonderKid",
      "header": {
        "uri": "\/gdc\/md\/a1bc2defghi3jk4lmno56pqr7s8t9uvw\/obj\/952",
        "identifier": "label.product.id.name"
      }
    },
    {
      "id": "m1",
      "title": "_Close [BOP]",
      "header": {
        "uri": "\/gdc\/md\/a1bc2defghi3jk4lmno56pqr7s8t9uvw\/obj\/9211",
        "identifier": ""
      }
    }
  ]
}
Drill Eventing versus Drill into Dashboard
Insights on dashboards may include the Drill into dashboard option (see Create Dashboards).
By default, if your embed a dashboard that includes insights with the Drill into dashboard set, the list of drillable items you send is ignored for these particular insights.
To override the Drill into dashboard and use your drilling settings, you must set the preventDefault URL parameter to true:
/dashboards/#/project/{projectHash}/dashboard/{dashboardID}?preventDefault=true
The table below shows how the preventDefault parameter affects the behavior when Drill into dashboard and/or drill eventing are enabled for an insight:
| preventDefault | Insight with drill into dashboard | Insight with drill eventing | What is used |
|---|---|---|---|
false | ❌ | ❌ | nothing |
| ✅ | ❌ | Drill into dashboard | |
| ❌ | ✅ | Drill eventing | |
| ✅ | ✅ | Drill into dashboard | |
| true | ❌ | ❌ | nothing |
| ✅ | ❌ | nothing | |
| ❌ | ✅ | Drill eventing | |
| ✅ | ✅ | Drill eventing |
The preventDefault=true parameter does not delete the Drill into dashboard settings. You can find the settings in drillTo details contained in the postMessage sent to your application.
For details see Capturing Events Sent from GoodData.
Sample HTML Page
To see an example HTML page with drill eventing implementation, read Sample HTML for Drill Eventing.
Embedded Dashboards with Navigation Panel Displayed
If you embed Dashboards, you can use the showNavigation=true to display the navigation panel with dashboards. For details, see Embed a Dashboard.
When you switch to another dashboard, the list of drillable items is lost. Your application must send a new list with drillable items after receiving the listeningForDrillableItems postMessage from GoodData.