You are viewing our older product's guide. Click here for the documentation of GoodData Cloud, our latest and most advanced product.
Pyramid Charts
This visualization is currently an opt-in feature. To enable this feature, follow the Configure Various Features via Platform Settings article. Note that if you are using GoodData.UI for custom apps and plugins, this feature is not going to be supported until GoodData.UI version 9 becomes available.
Pyramid charts are great at showing hierarchical structures and the relative proportions of different values. Typically, they are used for displaying demographic data, market segmentation, or organizational structures.
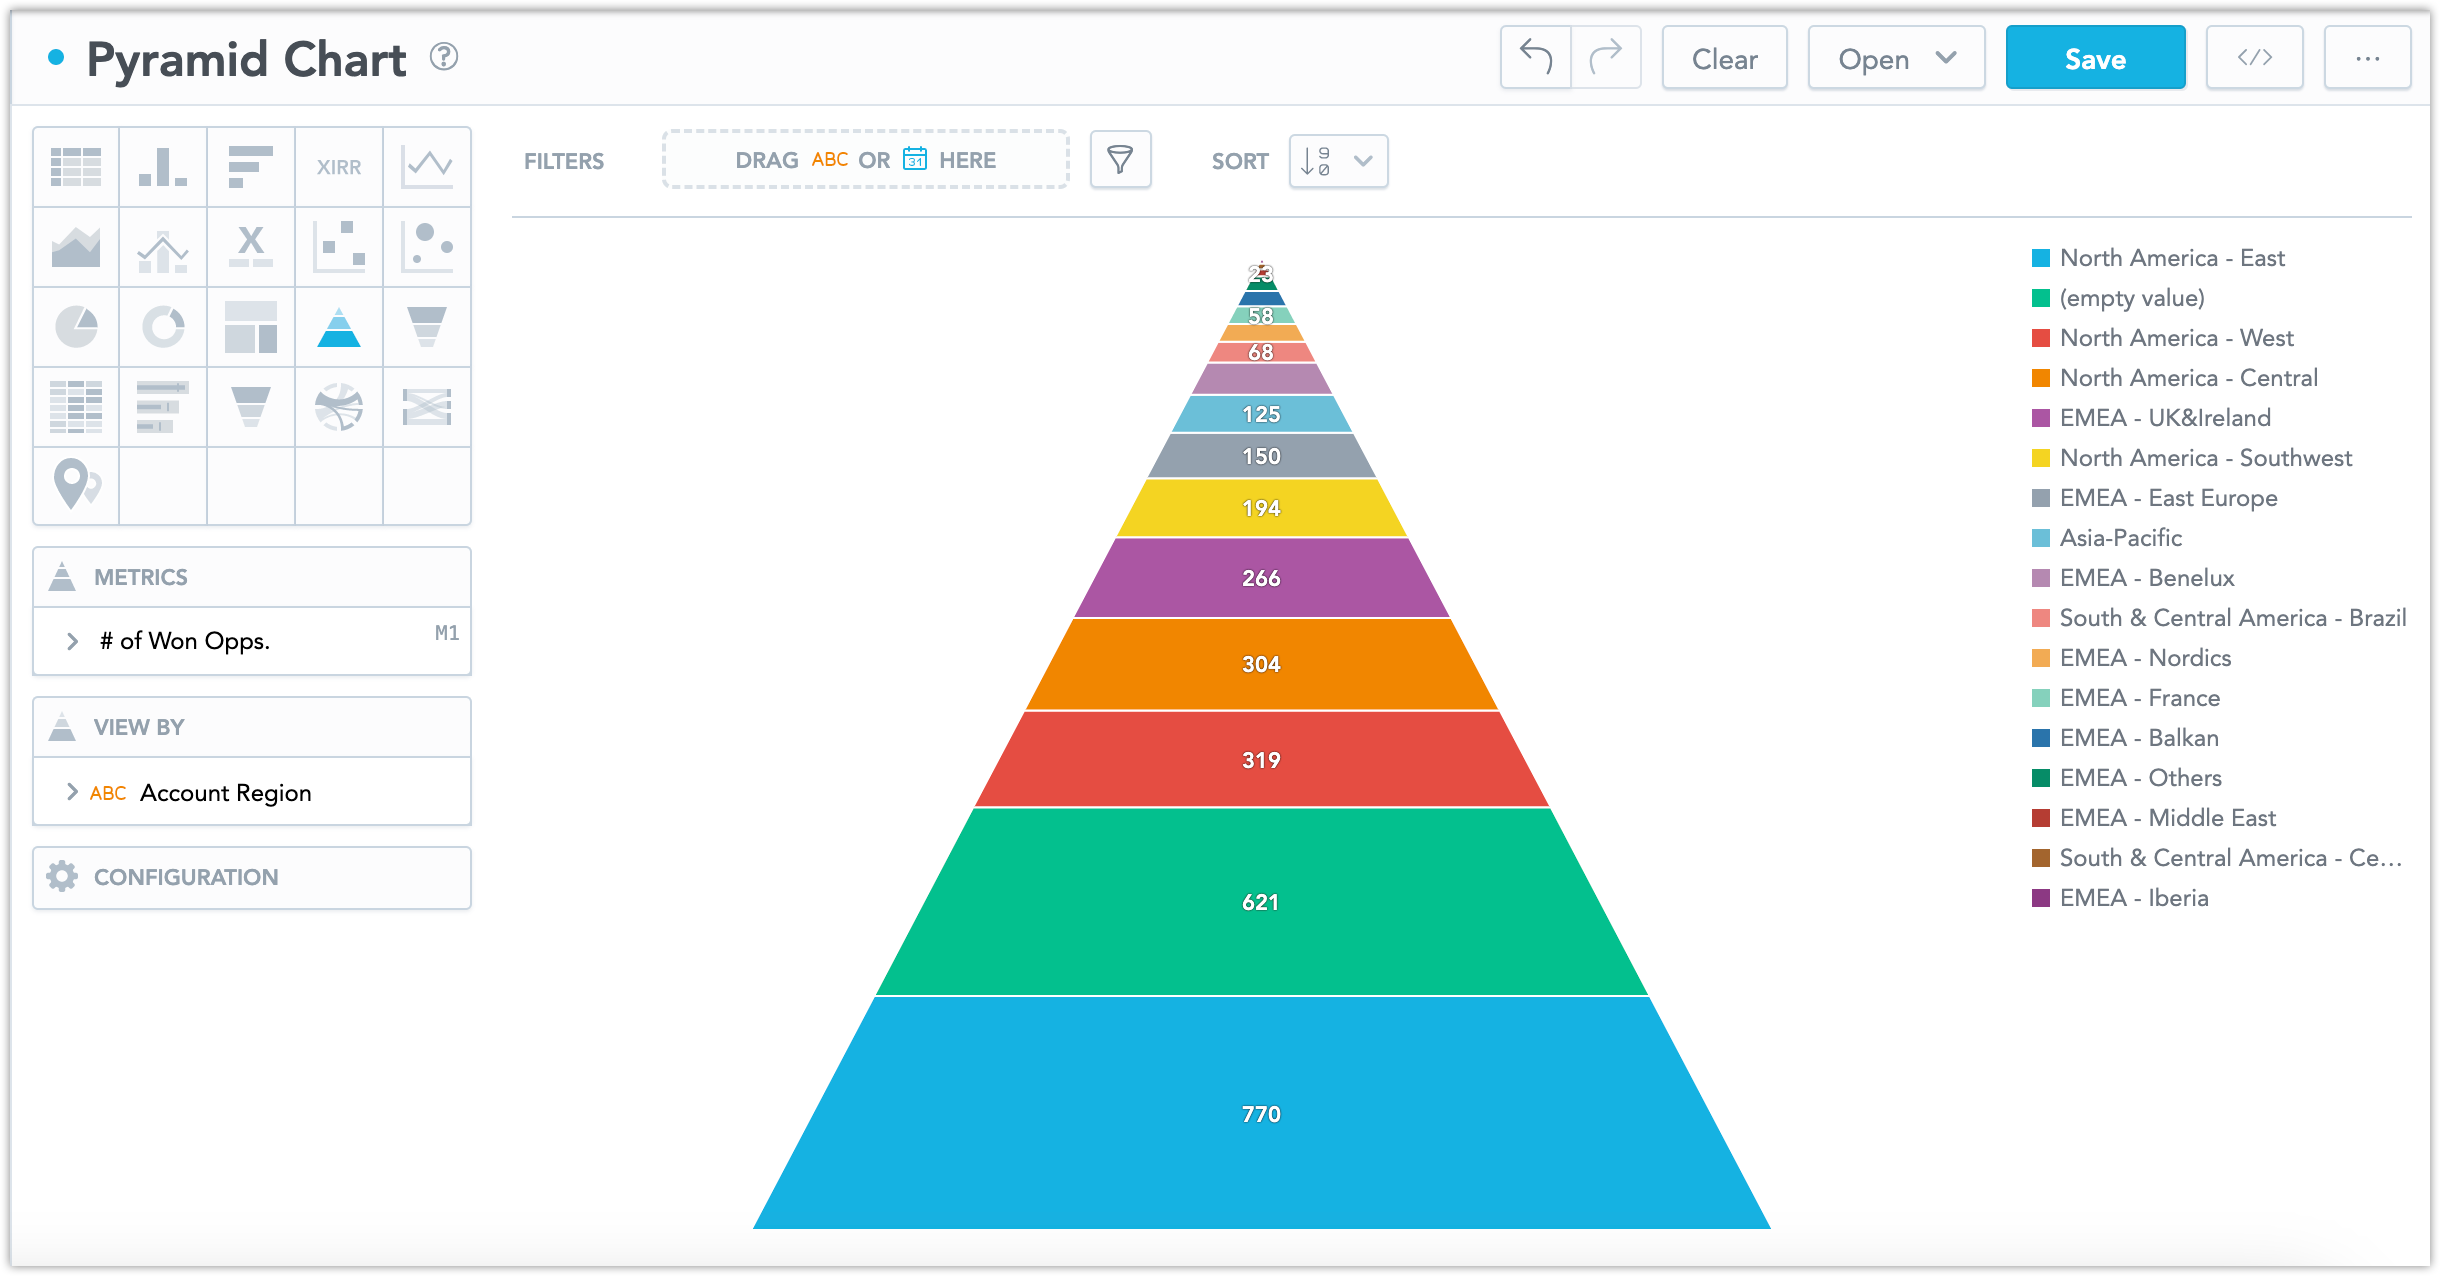
Pyramid Charts have the following sections:
- Metrics
- View By
- Configuration
For information about common characteristics and settings of all visualizations, see the Visualization Types section.