Transform Data for Batch Predictions and Recommendations
GoodData provides Predictions and Recommendations as an extension to the standard descriptive analytical capabilities. Predictions are produced from ingested data using Machine Learning (ML) models.
The Predictions and Recommendation functionality includes the following features:
- ML Model Fitting: Using fitting data, create a fitted model that represents an underlying function that relates data features to the predicted value.
- ML Model Execution: For a single observation, calculate the predicted value using the fitted model.
- ML Model Validation: Evaluates accuracy performance of a specific model.
- ML Reporting: Monitors KPIs related to predictions, including but not limited to throughput and performance.
The Predictions and Recommendations functionality is subject to the key dependencies and limitations.
The processes calculating Predictions and Recommendations are executed inside the GoodData Data Warehouse data pipeline. It uses a set of machine learning algorithms that can be divided into the following categories:
- Supervised learning algorithms
- Unsupervised learning algorithms
Platform Architecture
Calculation of predictions is a part of the GoodData platform data pipeline. You can enrich your data in GoodData Data Warehouse with values that are predicted using machine learning (ML) models. A machine learning model is created, fitted, and executed via machine learning bricks. ML bricks with specific machine learning algorithms are managed in GoodData Appstore.
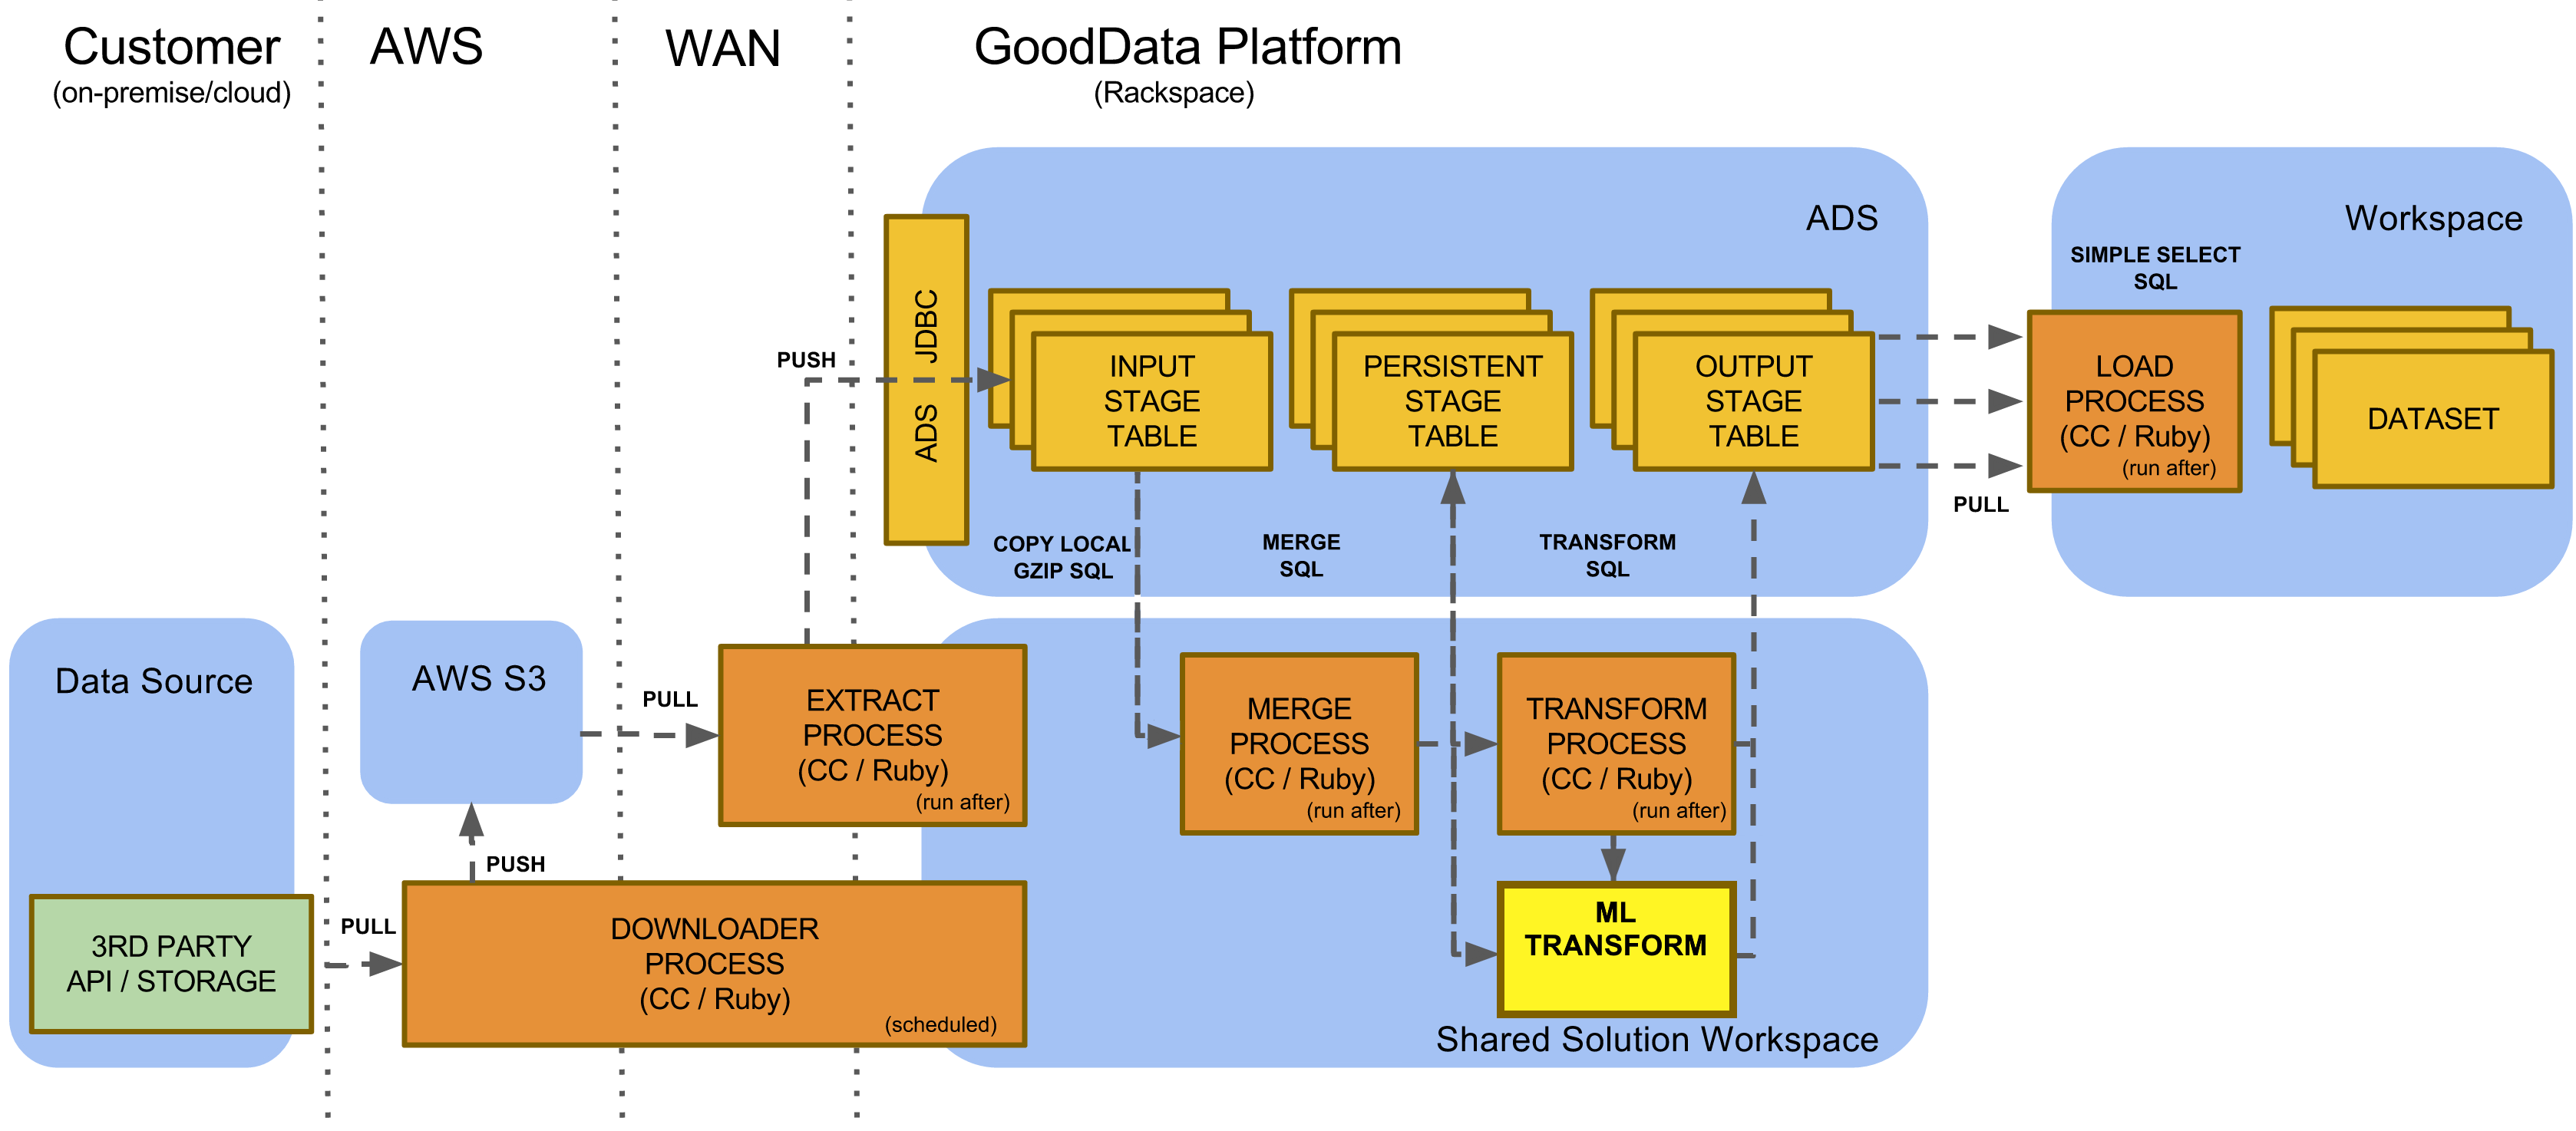
The ML bricks configuration and scheduling is managed via the Data Integration Console (see Data Integration Console Reference) typically using a dedicated Shared Solution Workspace. The whole data pipeline configuration orchestrates ML bricks including data preprocessing that prepares data for Machine Learning, and data post processing that transforms and incorporates ML predictions into output stage aligned with LDM (see Data Modeling Using the CloudConnect Tool). Data Warehouse supports preprocessing and postprocessing functions to simplify data transformations for ML (see Data Preparation and Data Evaluation Functions).
For monitoring and administrative purposes, all ML bricks are instrumented to monitor and store information in GoodData Data Warehouse about executing, fitting, and validating ML models. ML Reporting uses standard GoodData workspace capabilities to provide reports and dashboard related to predictions.
Currently, ML Implementations using pre-processing, ML algorithm, post-processing, reporting and custom bricks are implemented, deployed, and configured by GoodData Services under the aforementioned statement of work.
Supervised Learning Algorithms
Supervised learning algorithms enable “future” predictions of a key feature called Dependent Variable (DV) determined by “future” observations of a set of related features called Independent Variables (IV). Predictions of DVs are called Predicted Values (PV). Enabling “future” predictions is done via estimating an underlying function that relates the “past” IVs to their respective DVs.
Supervised learning algorithms run on the following distinct functional stages:
- Fitting stage (also known as training stage) where a fitted model of the underlying function is prepared
- Execution stage where predictions are made for “future” observations based on the prepared fitted model
Unsupervised Learning Algorithms
Unsupervised learning algorithms create critical distinctions about a set of observations. Unsupervised learning algorithms tie the value of a “future” prediction to the quality of the distinction that they can make about the “past” observation.
Unsupervised learning algorithms run on the following distinct functional stages:
- Fitting stage where a set of observations are used to make critical distinctions and each observation is assigned an additional critical distinction feature called Predicted Value (PV). This also produces a fitted model which can be used to assign PV’s to new observations.
- Execution stage where the fitted model is applied to observations, calculating a new PV for each observation. This stage is available for Unsupervised learning algorithms use cases even though it may not be used.
Functional ML Stages
Fitting Stage
For supervised learning algorithms, the fitting stage allows to create a fitted model by training the algorithm with “past” observations.
For supervised learning algorithms specifically, the fitting stage is also known as the training stage. The dataset of observations used for training is called training data.
Every observation must have a set of features called Independent Variables (IV). The training data uses these IVs to predict the key feature called Dependent Variable (DV). Every observation of the training data must have a real value for its DV.
The fitting stage creates no Predicted Values. The output of the Supervised Learning Algorithms fitting stage is a fitted model, and metadata about the fitted model.
For unsupervised learning algorithms, the fitting stage creates both a fitted model and a set of Predicted Values for every observation in the dataset. The dataset for unsupervised learning algorithms is called fitting data.
For functional purposes, training data and fitting data as with training stage and fitting stage can be used interchangeably.
The output of the unsupervised learning algorithms fitting stage is a set of PVs for every observation in the fitting data, a fitted model, and metadata about the fitted model. The PVs produced in the fitting stage are usually of primary business importance.
The fitting stage also has a pre-processing Transform stage and a post-processing Transform stage.
- In the pre-processing Transform stage, data-wrangling is performed in order to prepare the data for fitting.
- In the post-processing Transform stage, the PV’s and other outputs are transformed into business-logic focused metrics.
Execution Stage
For supervised learning algorithms, the execution stage is where the batch processes observations of IVs to create a batch of PVs for the DVs. This is typically scheduled at a set interval.
To create PVs, the execution stage retrieves the appropriate fitted model for the observation in question and retrieves the execution input features (EIF) from the batch process. The fitted model must have been previously generated during the fitting stage. If the fitted model does not exist, the execution stage cannot process the observations. The EIFs must follow the same format and structure as the fitting data.
For unsupervised learning algorithms, the batch processes sets of observations to assign PVs for the observations. This is typically scheduled at a set interval.
To create PVs, the execution stage retrieves the appropriate fitted model for the observation in question and retrieves the execution input features (EIF) from the batch process. The fitted model must have been previously generated during the fitting stage. If the fitted model does not exist, the execution stage cannot process the observations. The EIFs must follow the same format and structure as the fitting data.
The execution stage also has a pre-processing Transform stage and a post-processing Transform stage.
- In the pre-processing Transform stage, data-wrangling is performed on the EIF’s in order to prepare the data for fitting.
- In the post-processing Transform stage, the PV’s are transformed into business-logic focused metrics.
Validation Stage
The validation stage is part of the feedback loop for a System of Insights. Its goal is to ingest Results data from the Client System into GoodData Data Warehouse, and then to process the results data, along with outputs from the other two stages in order to create ML Reporting metrics.
This process does not involve Machine Learning, but will require algorithmic and statistical processing.
The results of this stage comprise the source data for ML Reporting.
ML Reporting
ML Reporting provides monitoring of KPIs related to predictions covering throughput, performance, and business reports. The reports are typically exposed via a dedicated Workspace and must be linked with the specific predictions and recommendations use cases.
Due to tight specific ML use cases dependencies, ML Reporting dashboards are implemented, deployed, and configured by GoodData Services.
Throughput Performance Reporting
The ML Reporting dashboards include graphs and KPIs that measure throughput of the ML system.
The following are examples of these KPIs, but actual KPIs will vary depending on implementation:
- # of Predictions
- # of Decisions
- Hours of ML Execution Time
- # of Trainings
Accuracy Performance Reporting
The ML Reporting dashboards include graphs and KPIs that measure the accuracy of the ML system.
The following are examples of these KPIs, but actual KPIs will vary depending on implementation:
- Accuracy %
- Approval %
- Avg. Error
- Precision
- Recall
Business-focused Reporting
The ML Reporting dashboards include graphs and KPIs that measure the results of the ML implementation in terms of business metrics and/or business policy metrics.
The following are examples of these KPIs, but actual KPIs will vary depending on implementation:
- Man Hours Saved per Month
- $ Saved per Month
- Model Attribute Importance
- Prediction Attribute Importance
- Average time to make decision
- Successful Decision Ratio
Key Dependencies and Limitations
- Use of the Predictions and Recommendations functionality is a premium service that is subject to an additional charge and requires signing an applicable addendum and an implementation statement of work. If you want to use such functionality, contact your Customer Success Manager.
- A Machine Learning system is heavily dependent upon the quality and quantity of data that is used as input. Supervised learning algorithms, in particular, rely on a varied and extensive data set in order to fit the internal model which enables accurate future predictions. The amount of data also increases with both the complexity of the prediction being made as well as the complexity of the algorithm selected. Specifically, the required data often goes up as a function of the number of classes predicted, input features used, and model parameters being fitted. Furthermore, performance increases with cleanliness and structure of the data. Data that has a lot of null values, incorrect values, etc. makes a very poor input set. Performance is not linear to quantity of data, however, and does plateau after a sufficient amount of data is reached.
- Overall accumulated execution time of all the ML bricks cannot be higher than 96 hours per month. In case the execution time limit is not sufficient, contact your Customer Success Manager to design an advanced ML solution.
- Other limitations to the accuracy of the system include, but are not limited to the following:
- Inherent complexity of the problem being solved: All ML Predictions are an attempt to separate underlying signal from noise. By taking into account all the variances in the input features and how they affect the predicted value, the ML system of the Predictions and Recommendations functionality attempts to predict the output. However, such ML system can never perform better than the accuracy determined by the inherent signal-noise ratio of the underlying problem.
- Ability of the algorithm to model the underlying problem: Different algorithms have different strengths and weaknesses. To simplify, they are all attempts at using algorithmic and statistical methods to model the effects of an underlying real-world situation. A simple algorithm, even with a large amount of training data, has its accuracy limited when attempting to model complex real-world phenomena that have stochastic, mechanistic, or functional components not captured by the model.
- Real-time Predictions and Recommendations: The real-time predictions functionality is excluded from Predictions and Recommendation functionality. It is an add-on requiring additional scoping and pricing.
This documentation and Predictions and Recommendations functionality is subject to change from time to time at GoodData’s sole discretion.