Edit Items on Dashboards
Overview
Dashboards have a flexible layout where you can add multiple insights and KPIs in a single row. To edit the layout and the individual widgets (insights or KPIs), click Edit in the top right corner.
You must have access to the dashboard and appropriate rights to edit it. For details, see User Roles and Share Dashboards.
The layouts of dashboards use a 12-column grid. By default, each widget has a specific number of columns assigned. The default height for widgets is 420px (220px for headlines).
To arrange items on a dashboard, select it in the list of dashboards and click Edit.
Add widgets to a dashboard
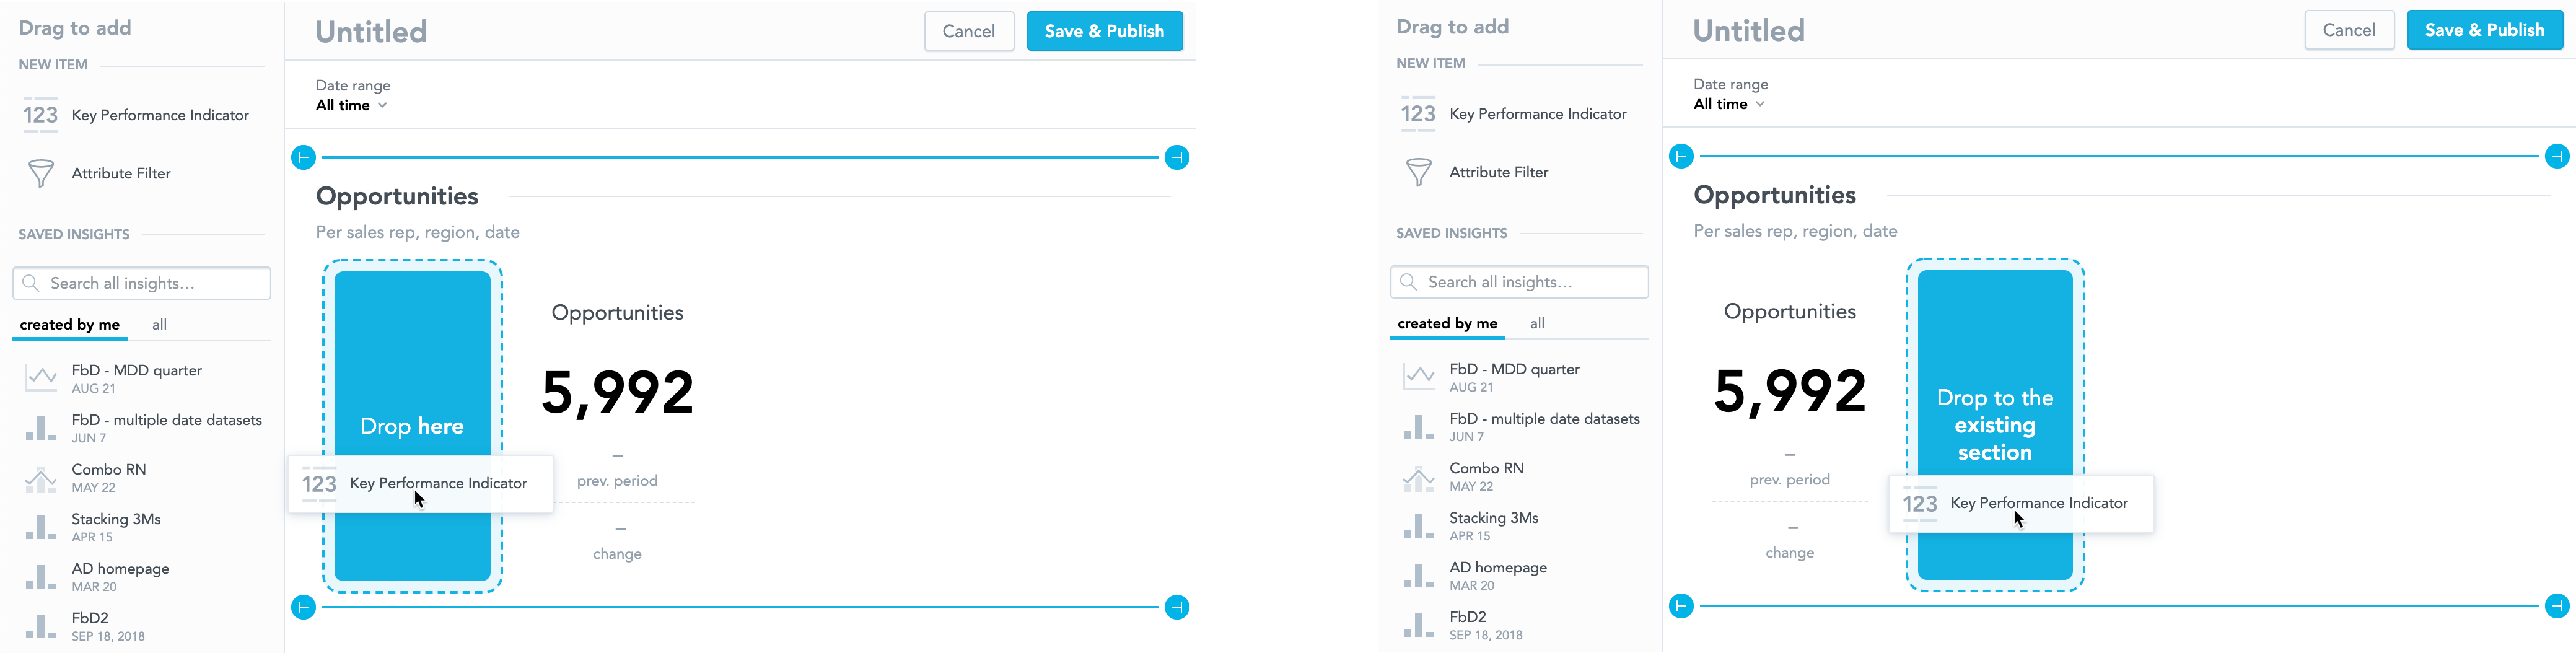
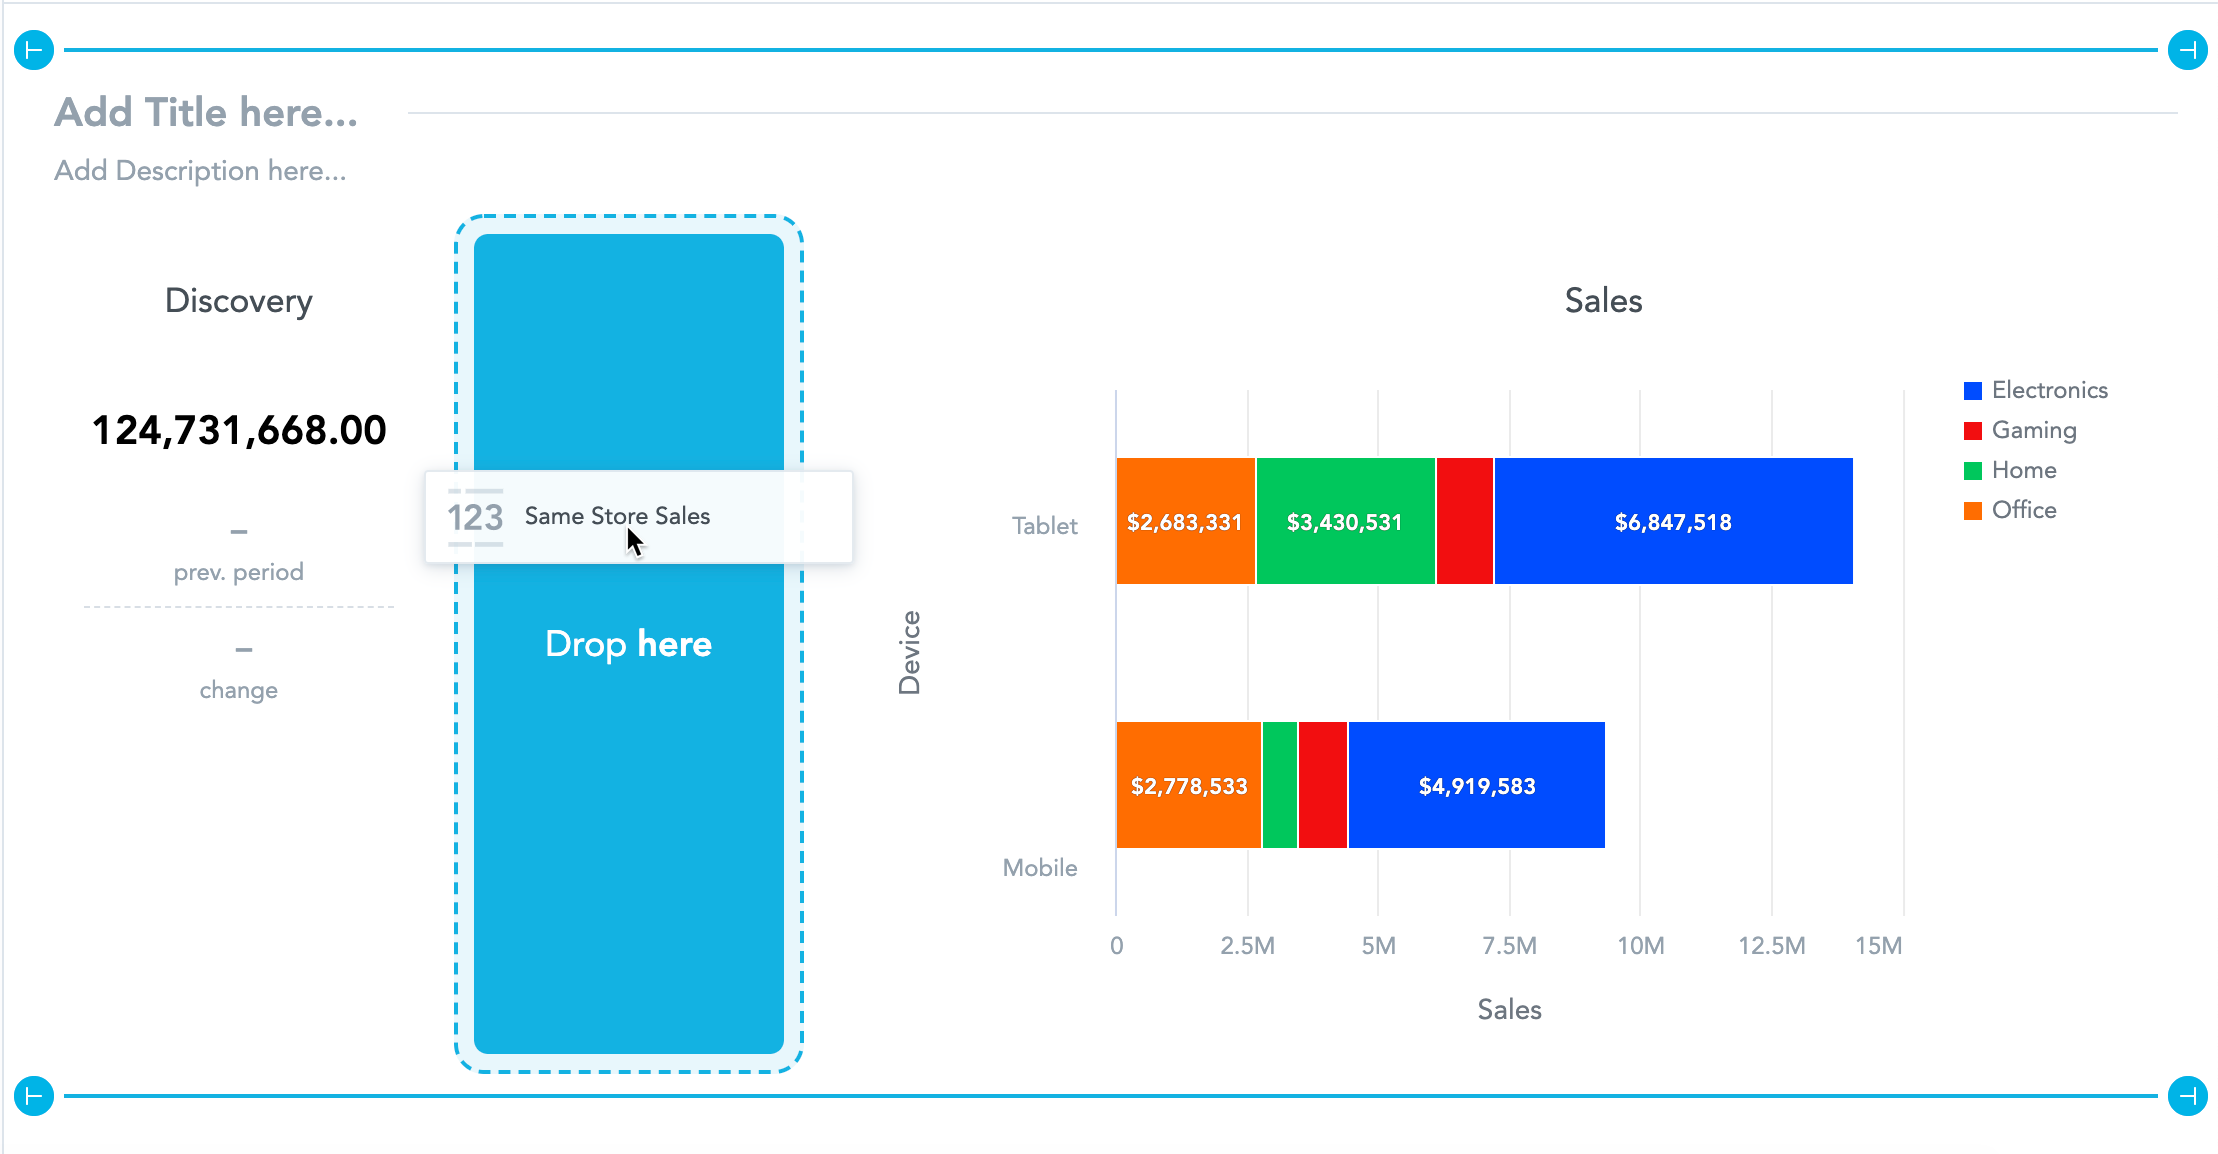
Add widgets to the same section
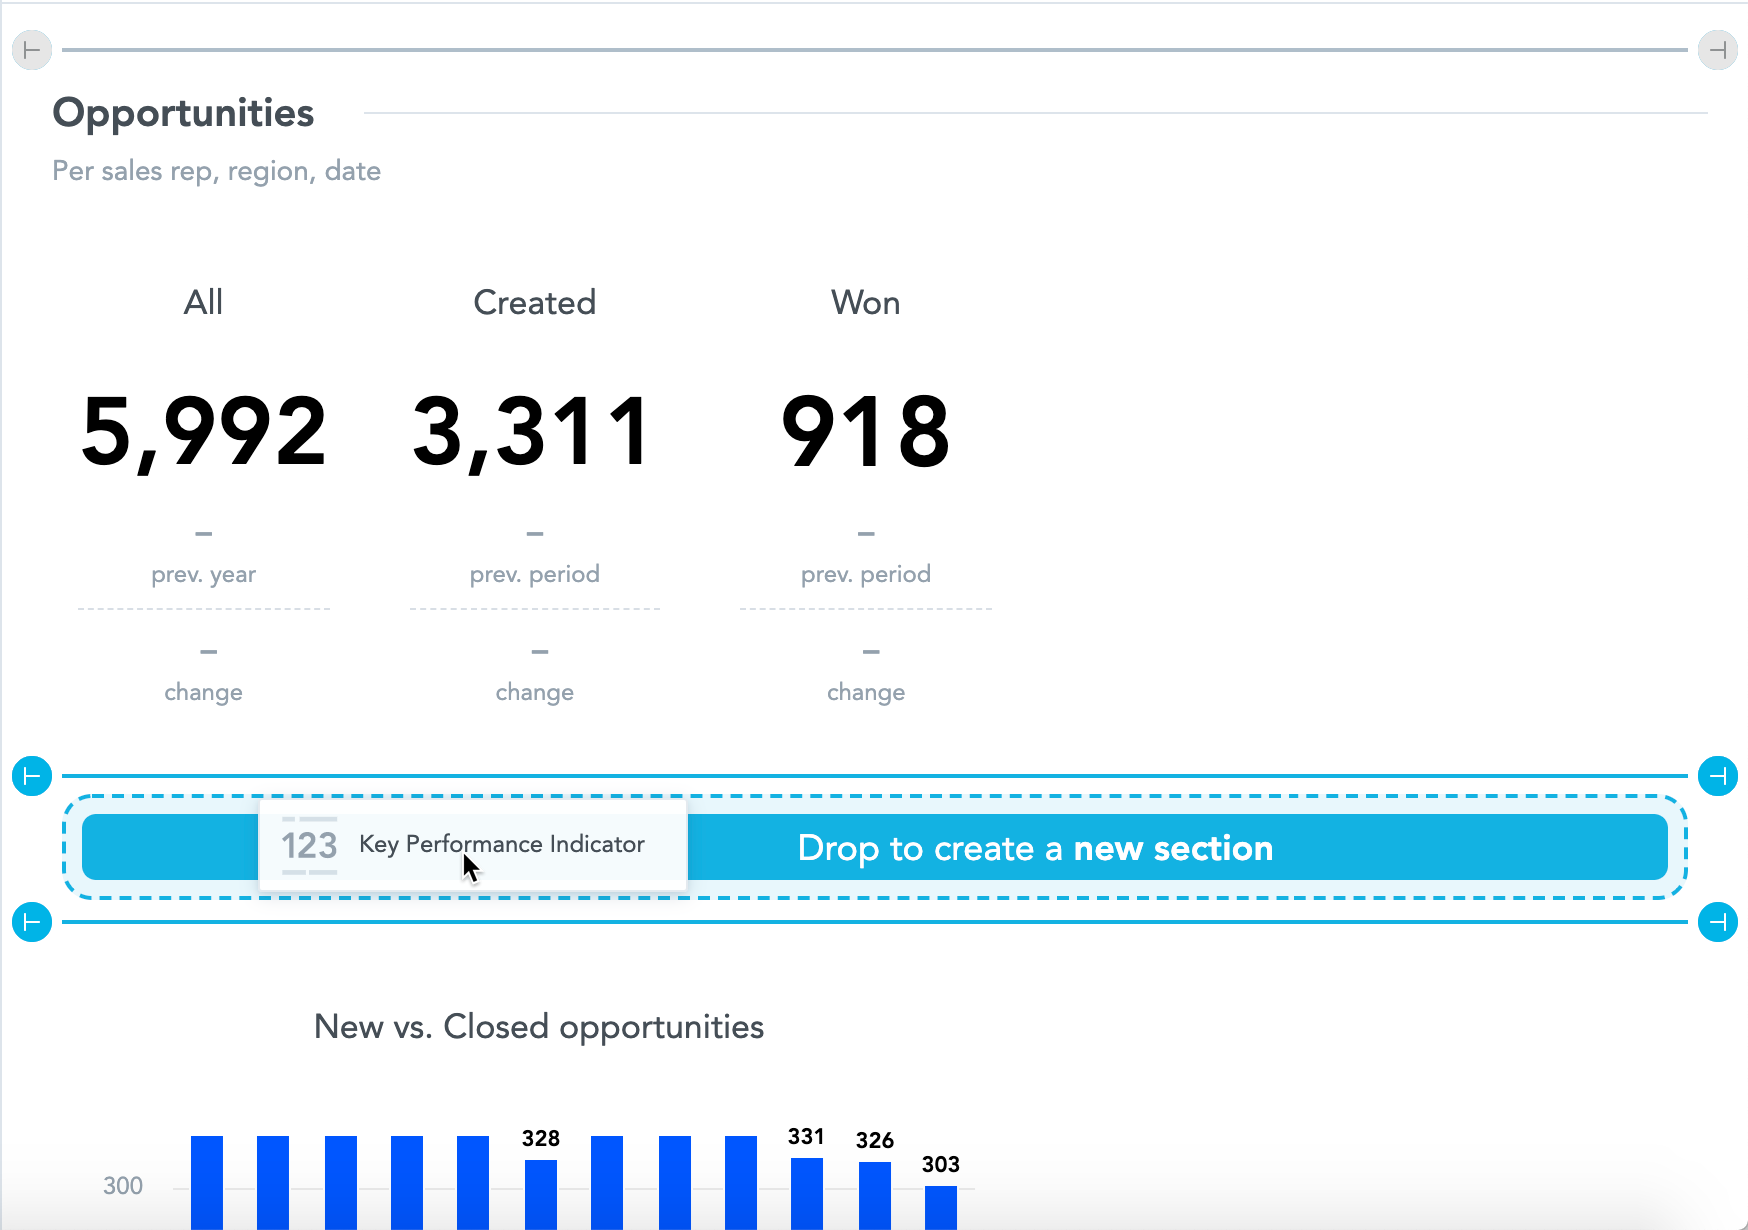
Add widgets to a new section
Rearrange widgets
To rearrange widgets on a dashboard, drag and drop them to a new place. The dashboard displays the target place as you drag the widget.
Resize widgets
All widgets have minimum width and height defined to maintain optimal readability.
You can adjust the size of the widgets on a dashboard to suit your needs.
Change width
To change the width, drag the right end of the widget to adjust the width (the number of columns it occupies).
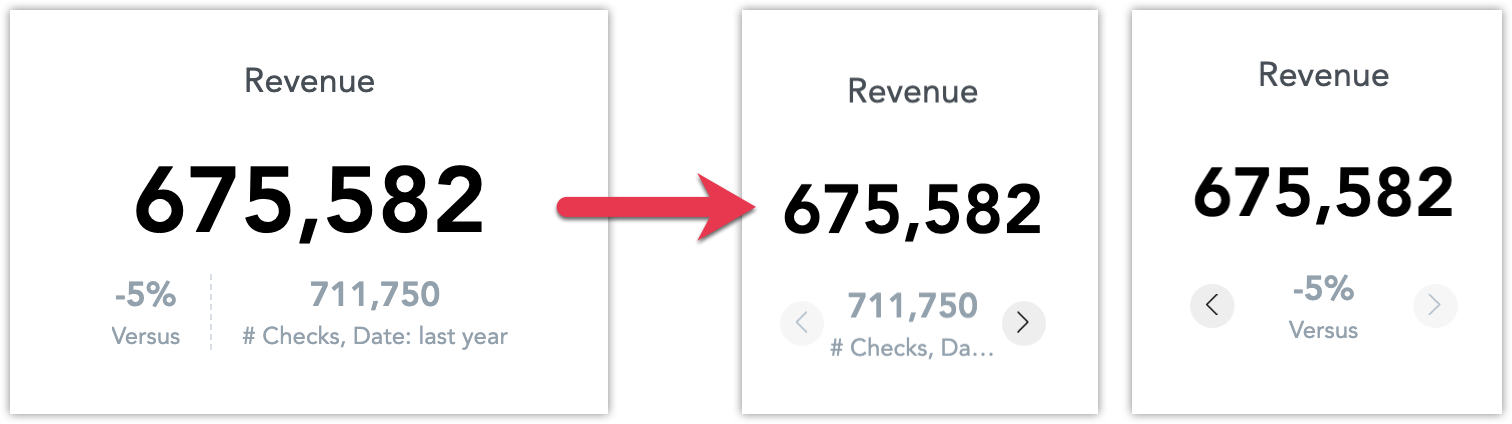
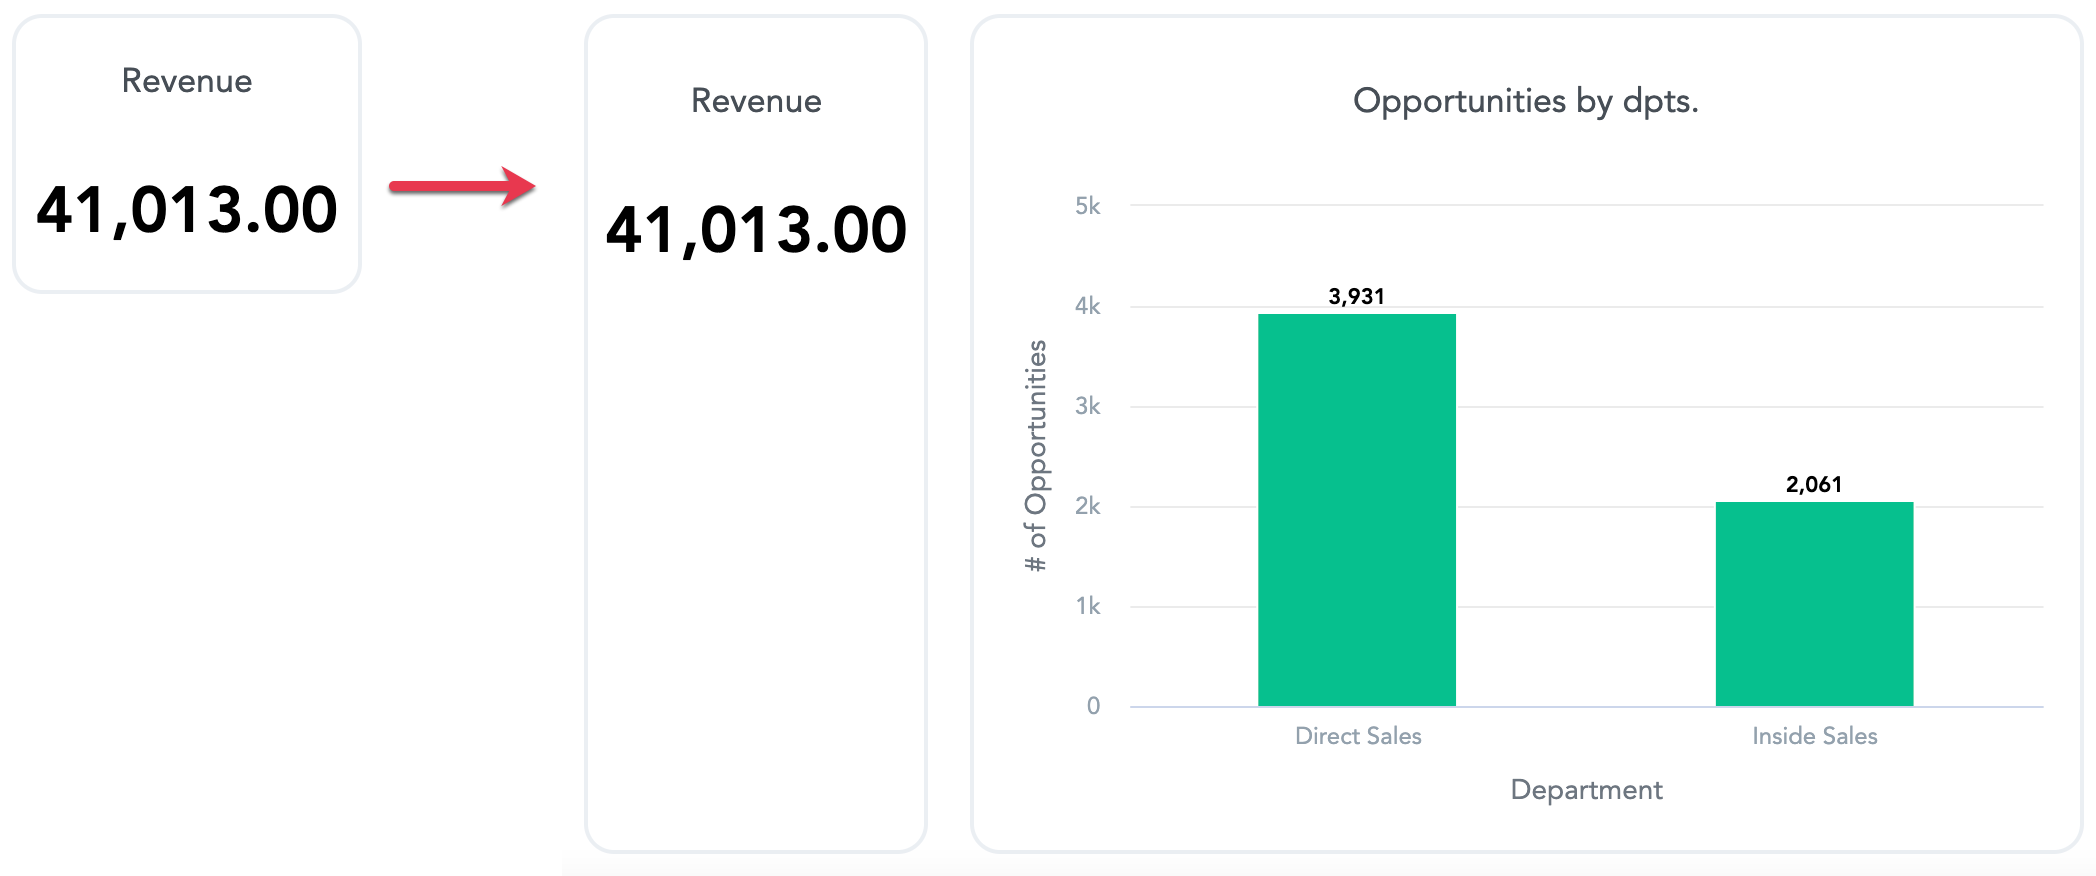
If the size of headlines and KPIs is too small to display nicely, additional information can be displayed by clicking on the arrows at the bottom.
Change height
To change the height, drag the bottom end of the widget to adjust the height of the whole visible row.
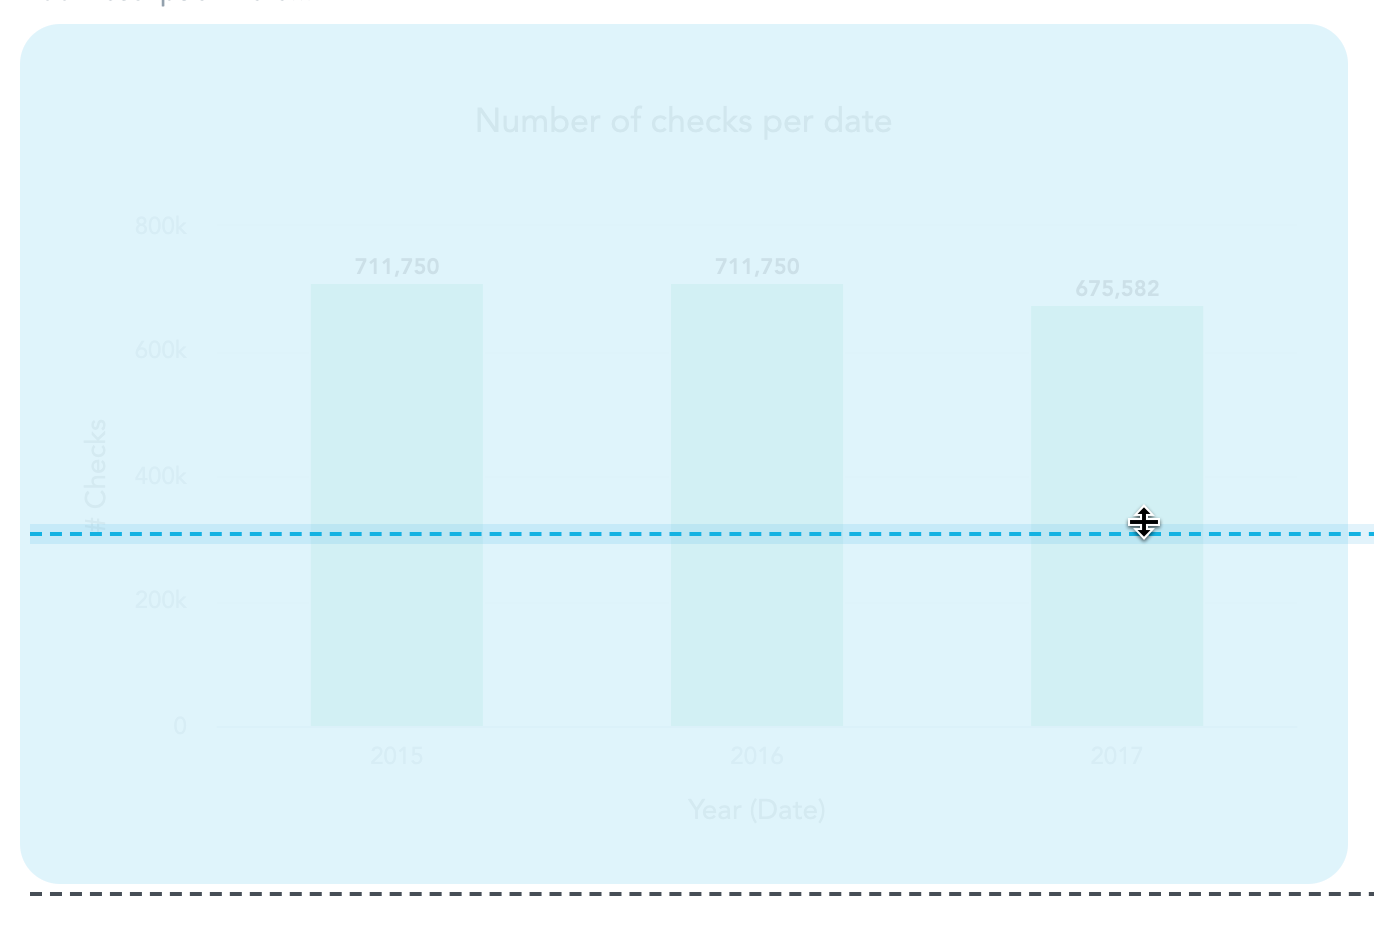
The row height is automatically adjusted to the height of the highest widget in the row. For example, if you have a headline widget and add a column chart, the height of the headline adjusts to the height of the column chart.
When the widget height (bar charts, column charts, line charts, pie charts, and donut charts) is reduced, the axes names and labels may be hidden to provide maximum space for the actual charts. For details about axes, see Configure Insight Properties.
Tables
If you add table insights to your dashboard, you can change the width of its columns on dashboards. Dashboards then preserve the width after saving. For details about the column width, see Tables.
Dashboards do not change the insight itself, only one particular instance. If your dashboard includes multiple instances of the same insight or if you have the insight on multiple dashboards, you must adjust the width in each instance.
Small tables are automatically resized to fit the whole width of the widget. To disable this resizing, set the enableTableColumnsGrowToFit platform setting to false. For details, see Configure Various Features via Platform Settings.
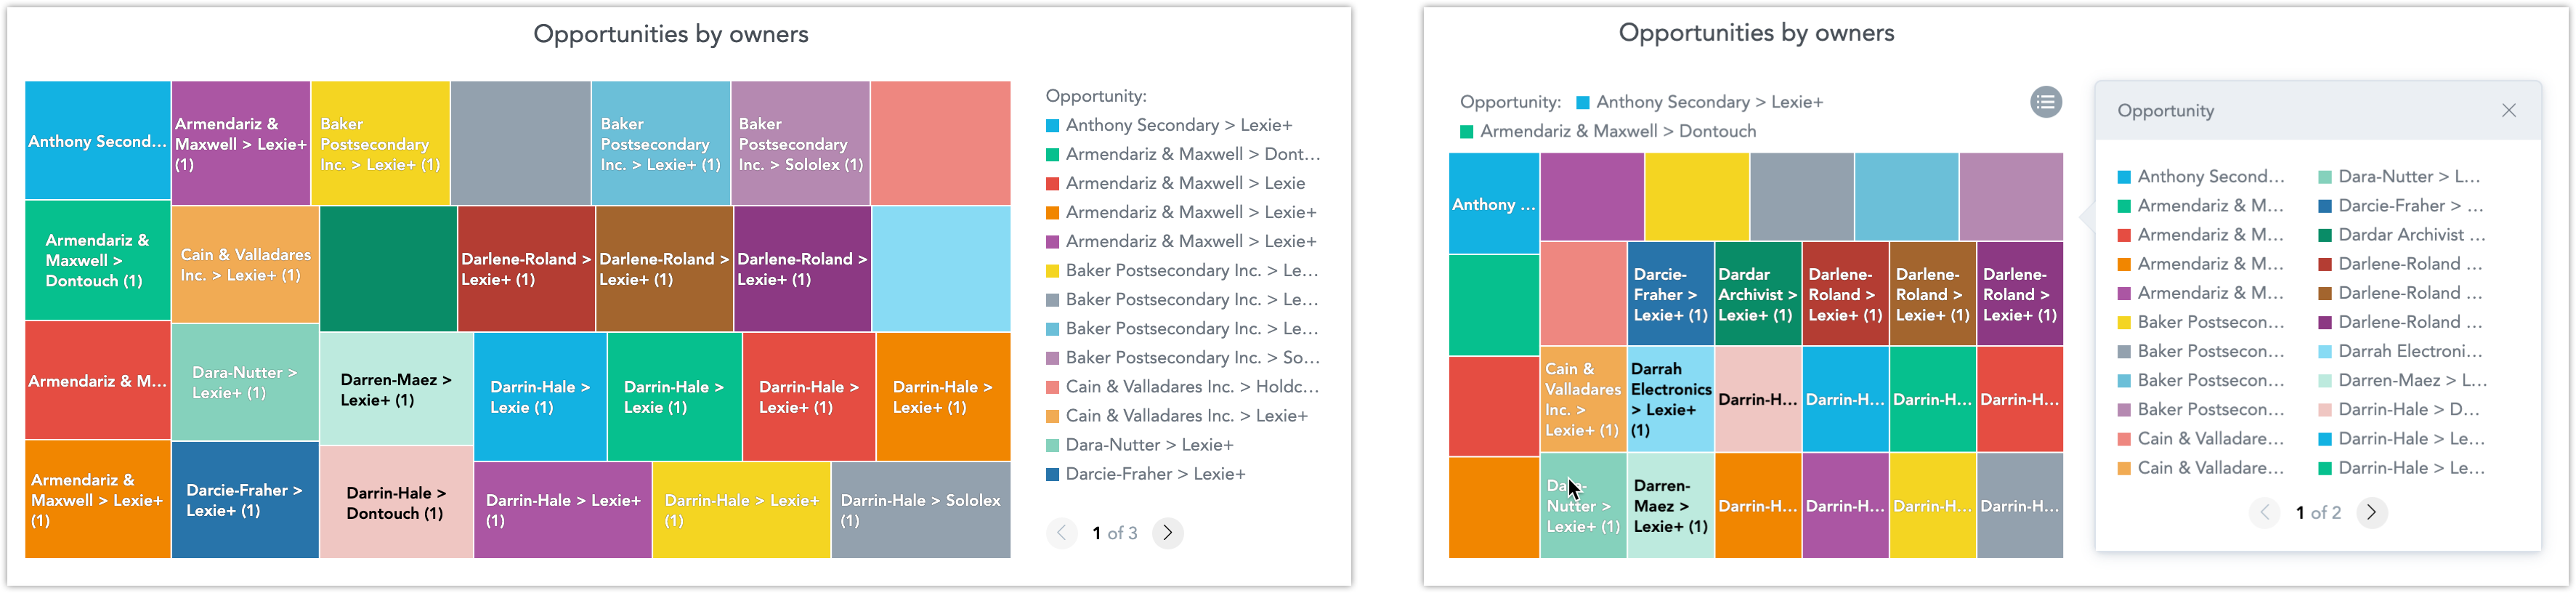
Legend position
If the legend of the insight would occupy a large area of the widget, the legend may:
- Become paginated
- Move to the top, display only a limited number of lines, and the rest of the items is available in a pop-up window upon clicking on the legend icon
Delete widgets
To delete a widget from a dashboard:
- Select the widget.
- Click the Trash icon in the top right corner of the widget.
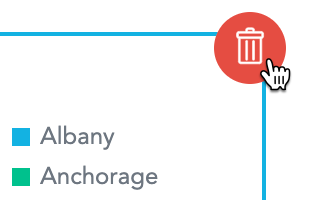
- Confirm the deletion.
Zoom insights
If your insights have too much information and are unreadable, you can zoom into details.
First, you must edit the dashboard to enable zooming for individual insights, then you can zoom insights when viewing the dashboard.
Steps:
- Click the insight.
- Select the Zoomable insight option.
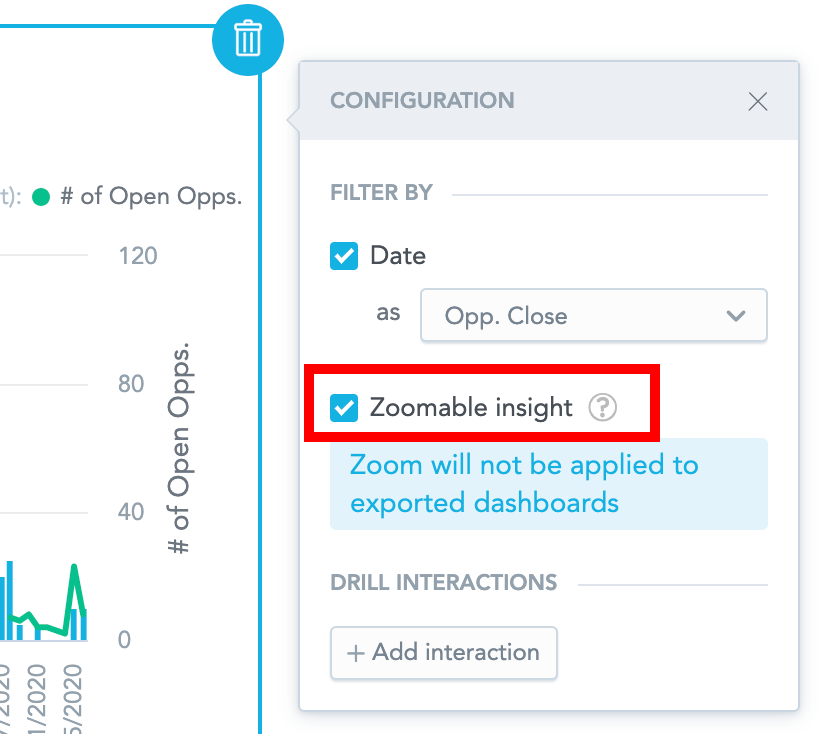
- Click Save & Publish.
- Click in the insight and drag your mouse over the area that you want to enlarge.
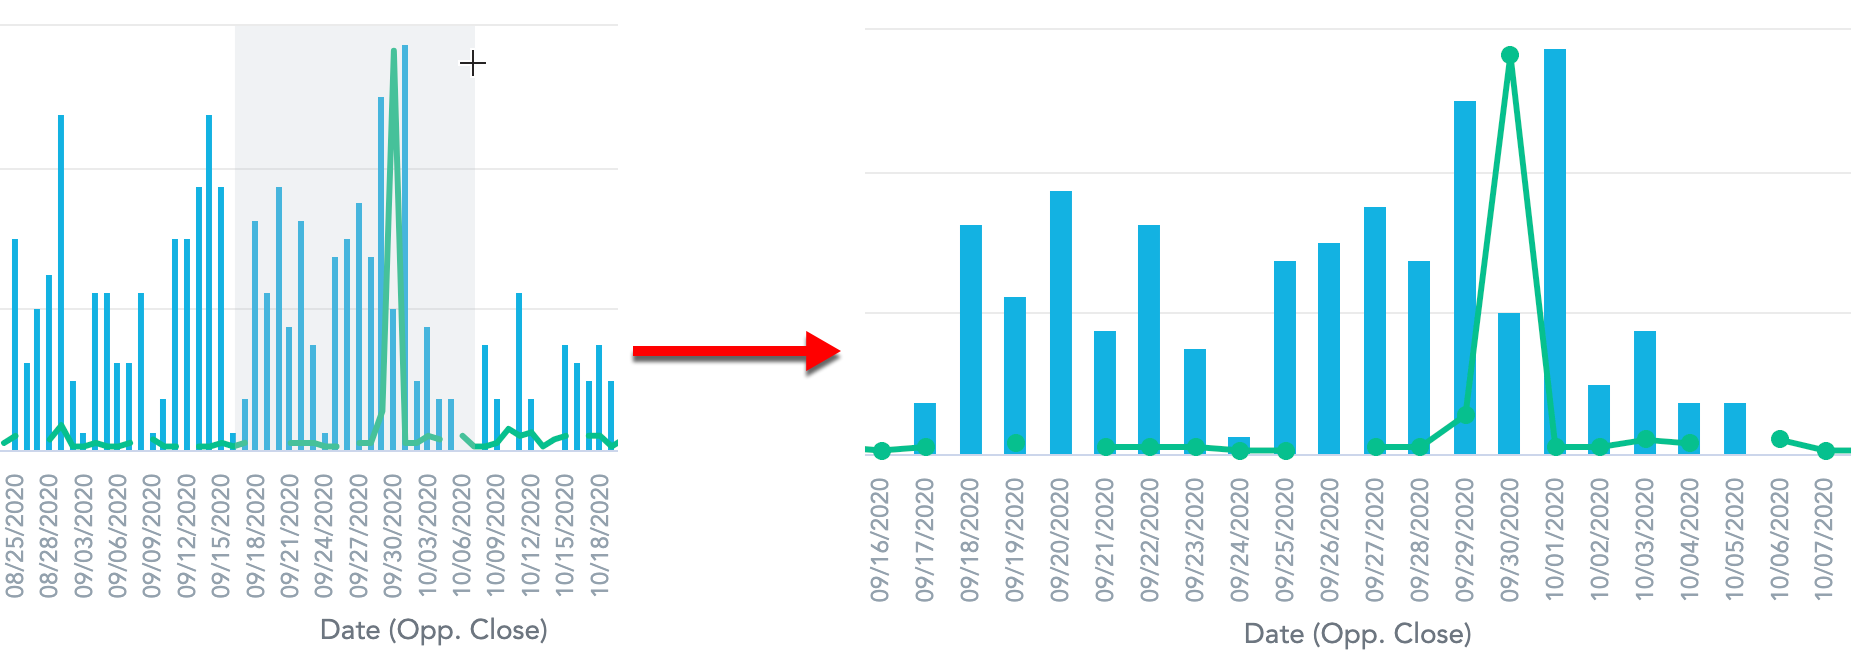
- Hold the Shift key to move through the zoomed insight.
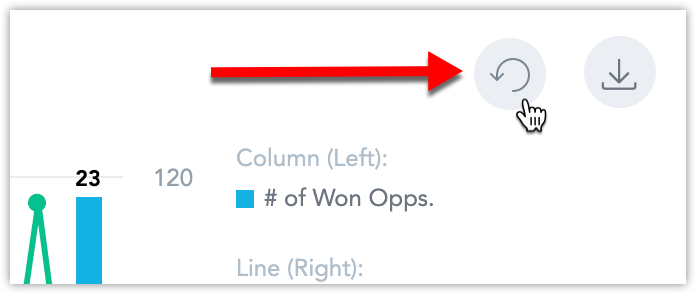
- To reset the zooming, click the Reset zoom icon.
- Zooming is available for all insight types except pie charts, donut charts, headlines, and tables.
- Zooming is not saved and not applied to exported dashboards.
- Zooming disables the ability to hide axes names and labels if the height is reduced.
- To disable zooming and remove the option from insight settings, set the
enableKDZoomingplatform setting tofalse. For details, see Configure Various Features via Platform Settings.
Explore insights
You must have at least Explorer rights to explore insights. For details, see User Roles.
To disable this feature, set the enableExploreInsightsFromKD platform setting to false. For details, see Configure Various Features via Platform Settings.
On dashboards, you can display insights in Analytical Designer to explore their settings. You can even edit the insight and save it as a new one.
- On your dashboard, click the three dots icon in the top right corner of the insight.
- Click Explore from here. The insight opens.
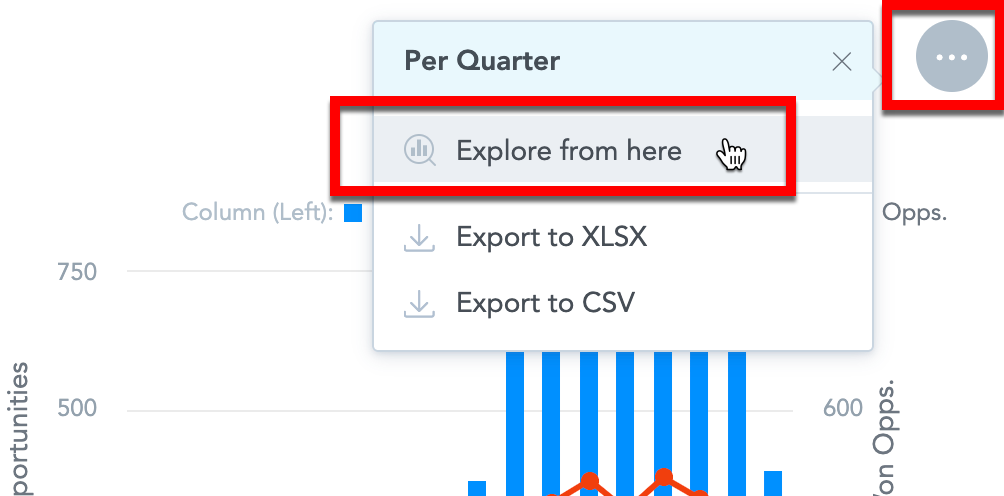
- To return to dashboards, click Cancel.
- You can edit the insight and then click Save to create a new insight. This does not update the insight on your dashboard. To add the new insight, you must edit the dashboard and add this insight to this dashboard.
Edit insights
You must have at least Editor rights to edit insights. For details, see User Roles.
To disable this feature, set the enableEditInsightsFromKD platform setting to false. For details, see Configure Various Features via Platform Settings.
On dashboards, you can edit insights in Analytical Designer and update them on your dashboards automatically.
- On your dashboard, click Edit to open the dashboard.
- Click the three dots icon in the top right corner of the insight.
- Click Edit. The insight opens for editing.
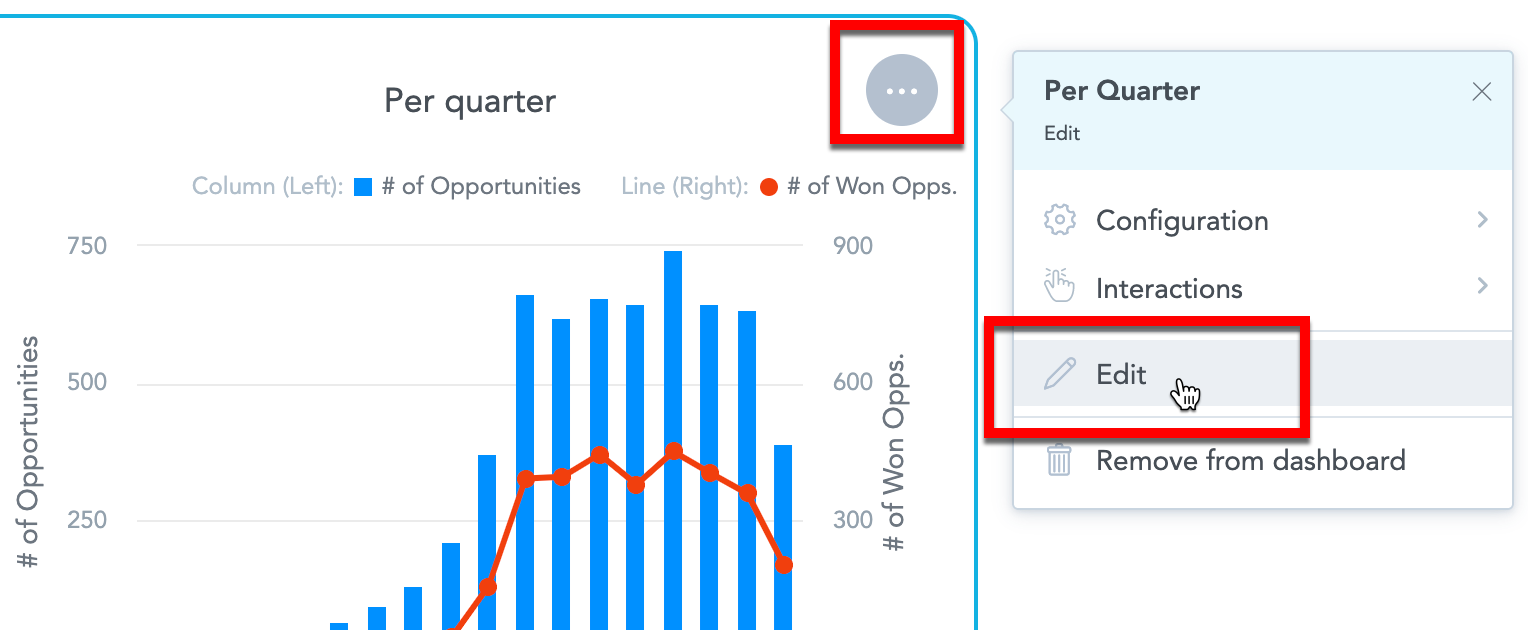
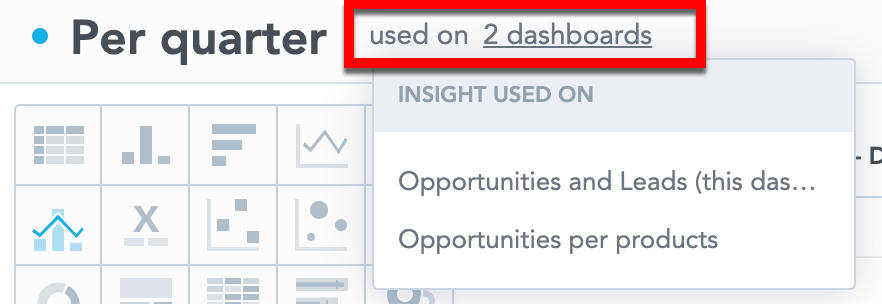
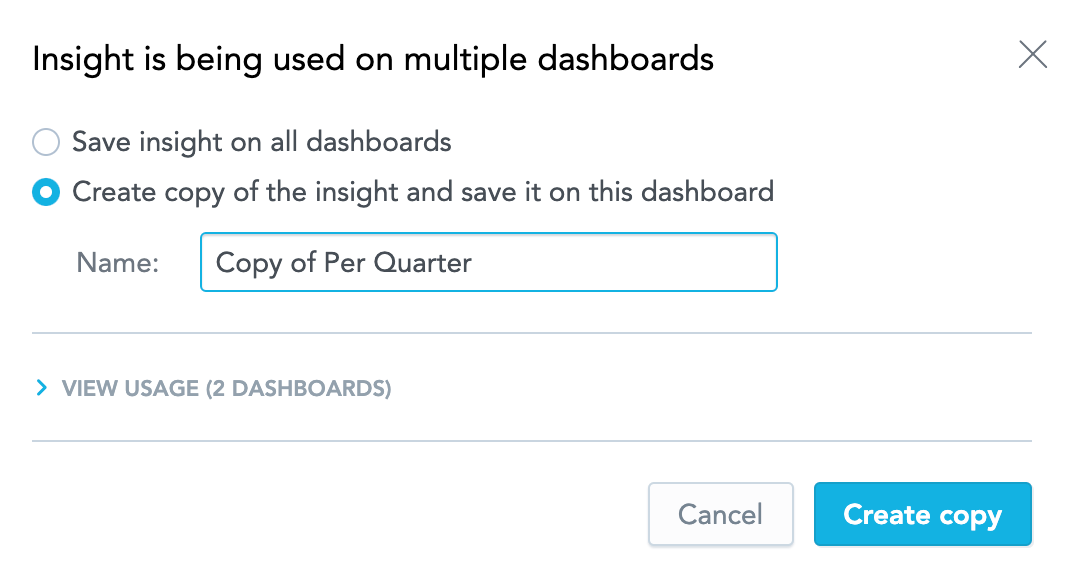
- Modify the insight. To see a list of dashboards that include this insight, click the link to the right of the insight name. Click the name of the dashboard to open it in a new window.
- If the insight is included on multiple dashboards and you want to update it on all dashboards, select Save insight on all dashboards and click Save.
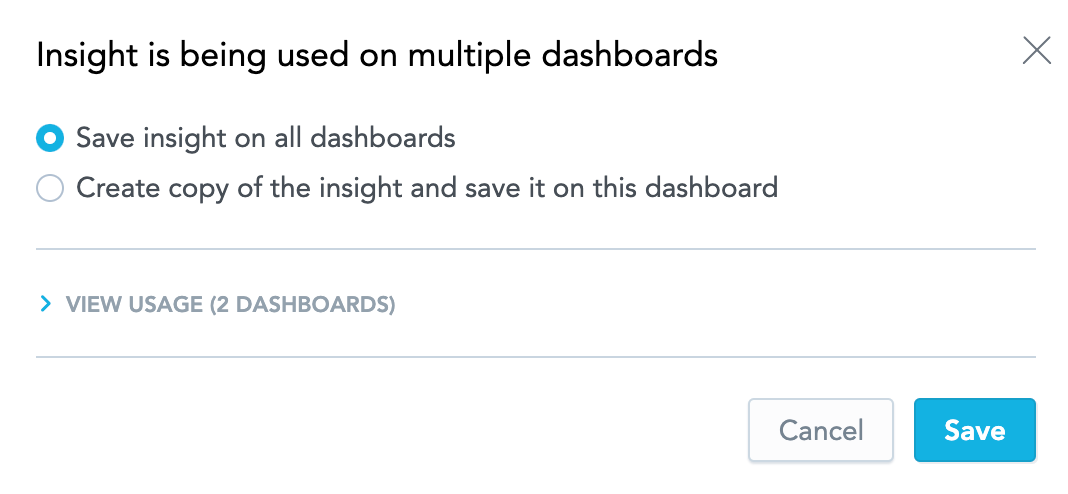
- If the insight is included on multiple dashboards and you want to update it only for the current dashboard, select Create copy of the insight and save it on this dashboard, type a new name and click Create a copy. Dashboard exchanges the insight for the new one.
- Click Save.
Responsive layout
The layouts are responsive to prevent the dashboard from being difficult to read on small screens. Dashboards use a predefined set of breakpoints that adjust the layout on display accordingly.

For example, if the size of the screen reaches a breakpoint, the widgets from one section may adjust the size and rearrange to two rows.