Drill Down in Dashboards
Overview
On dashboards, you can use the existing attribute drill paths that are defined to drill to when you click on an attribute value.
You can configure the drill paths in the Manage section (see Define global drill down paths below).
Drill down is not available in Geo Charts (pushpins) and if another drill is configured for the same attribute.
Steps
If the insight you add to a dashboard includes an attribute with a drill path configured, drill down works automatically.
Just click a fact, metric, or attribute value in the insight and the dashboard opens a drill window where the fact, metric, or attribute is:
- Filtered to the value you selected (clicked) in the original report, and
- Broken across the attribute from the drill down path.
See the following section for examples.
Define global drill down paths
Administrators can define global drill down paths, initiated by clicking values of an attribute wherever these values appear in the workspace.
- Switch to the Manage tab.
- In the sidebar, click Attributes.
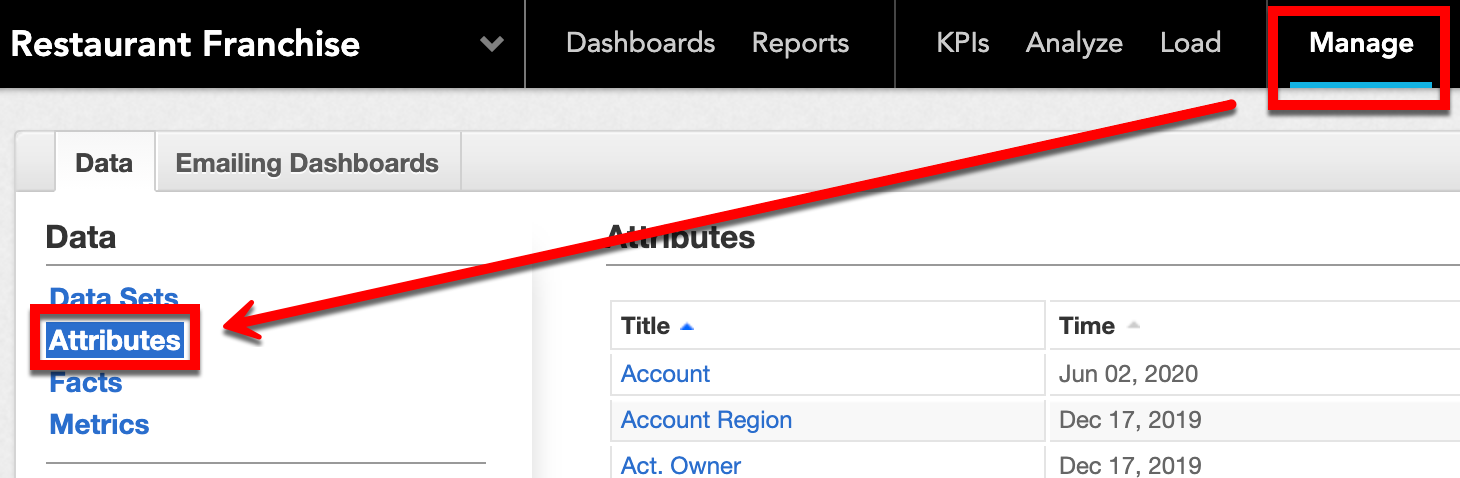
- Select an attribute from the list.
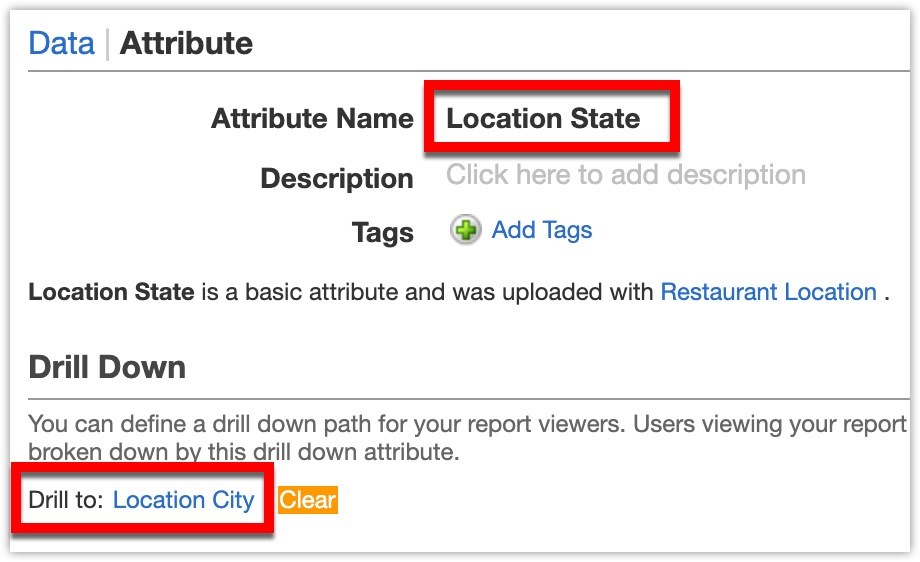
- Under Drill Down, click the Select Drill Attribute drop-down, and select the attribute to be used to break down metric values in a report where the drill-down is initiated.
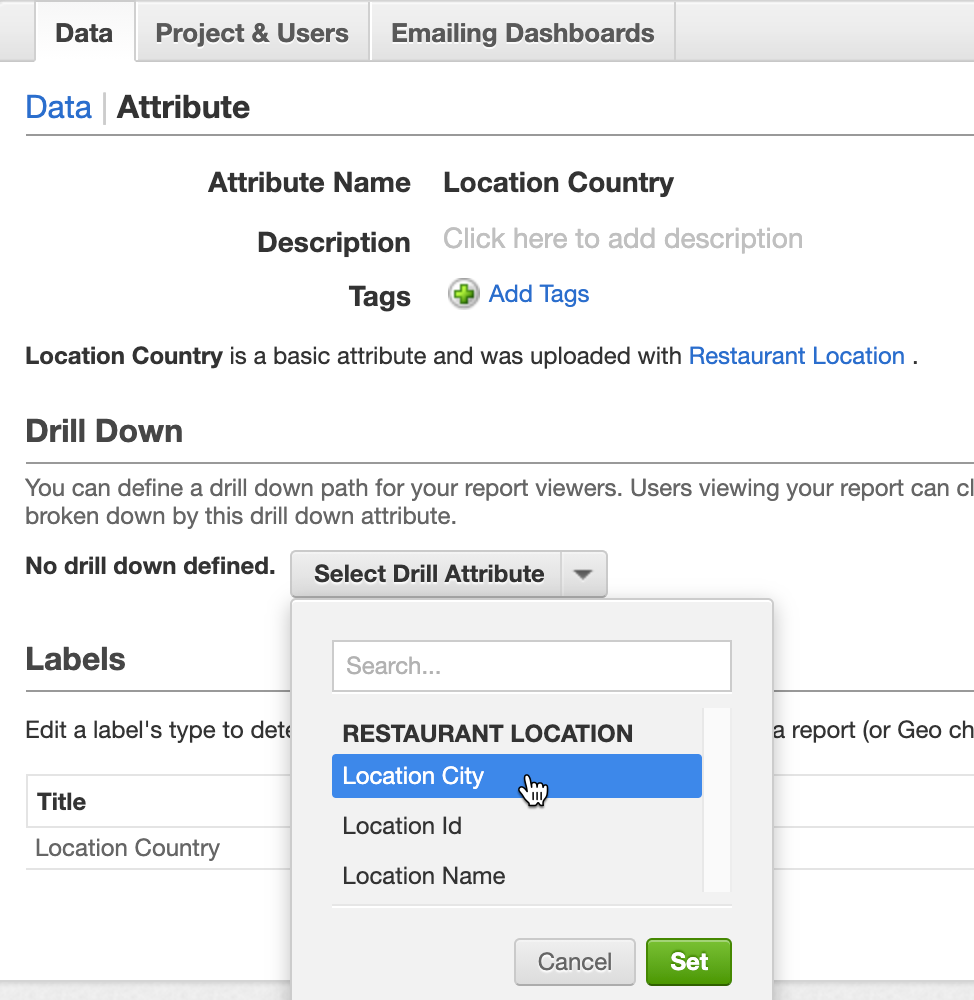
- Click Set. The attribute is defined.
Examples
Single drill down
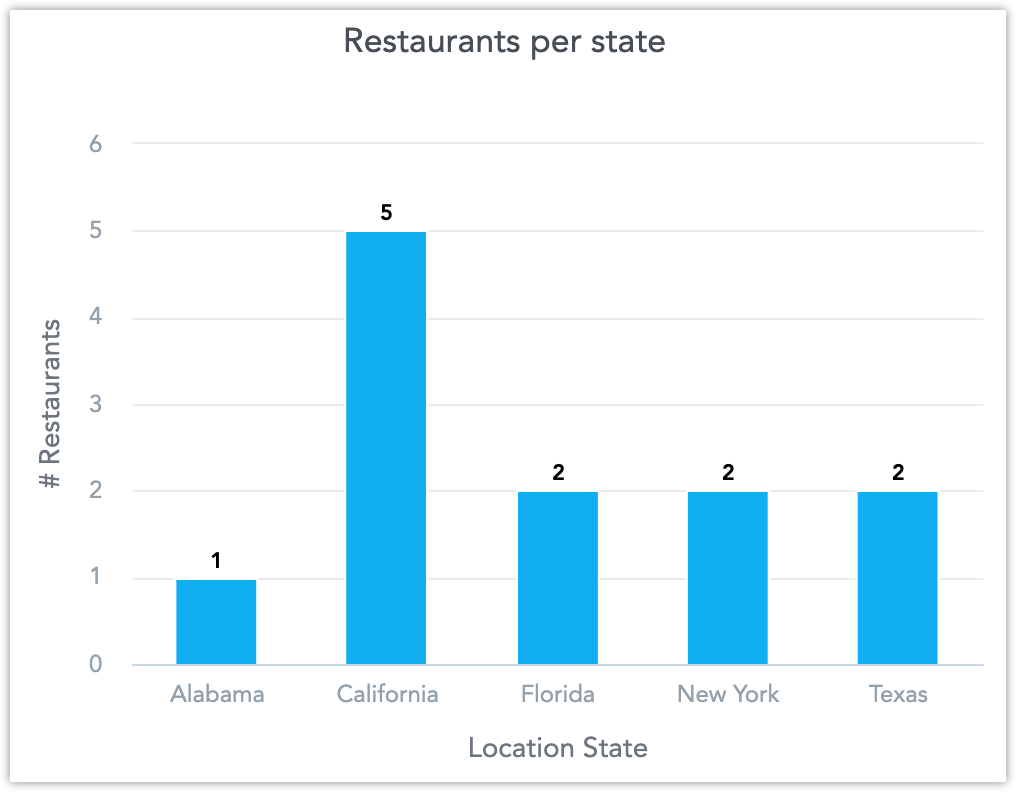
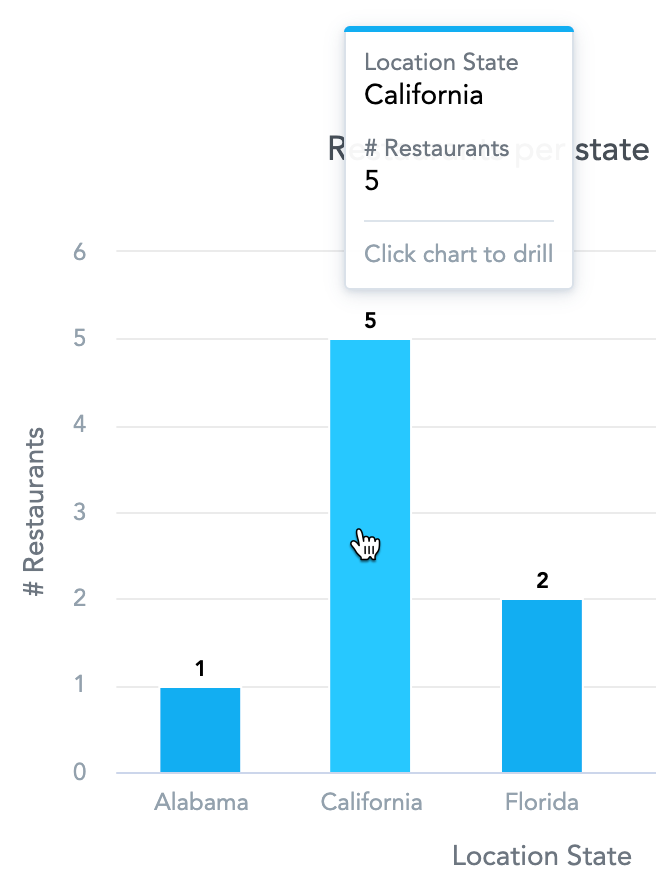
- Create an insight that includes the number of your Restaurants viewed by the Location state.
- In the Manage section, set the Location state attribute drill down path to Location city.
- Add the insight to a dashboard and save the dashboard.
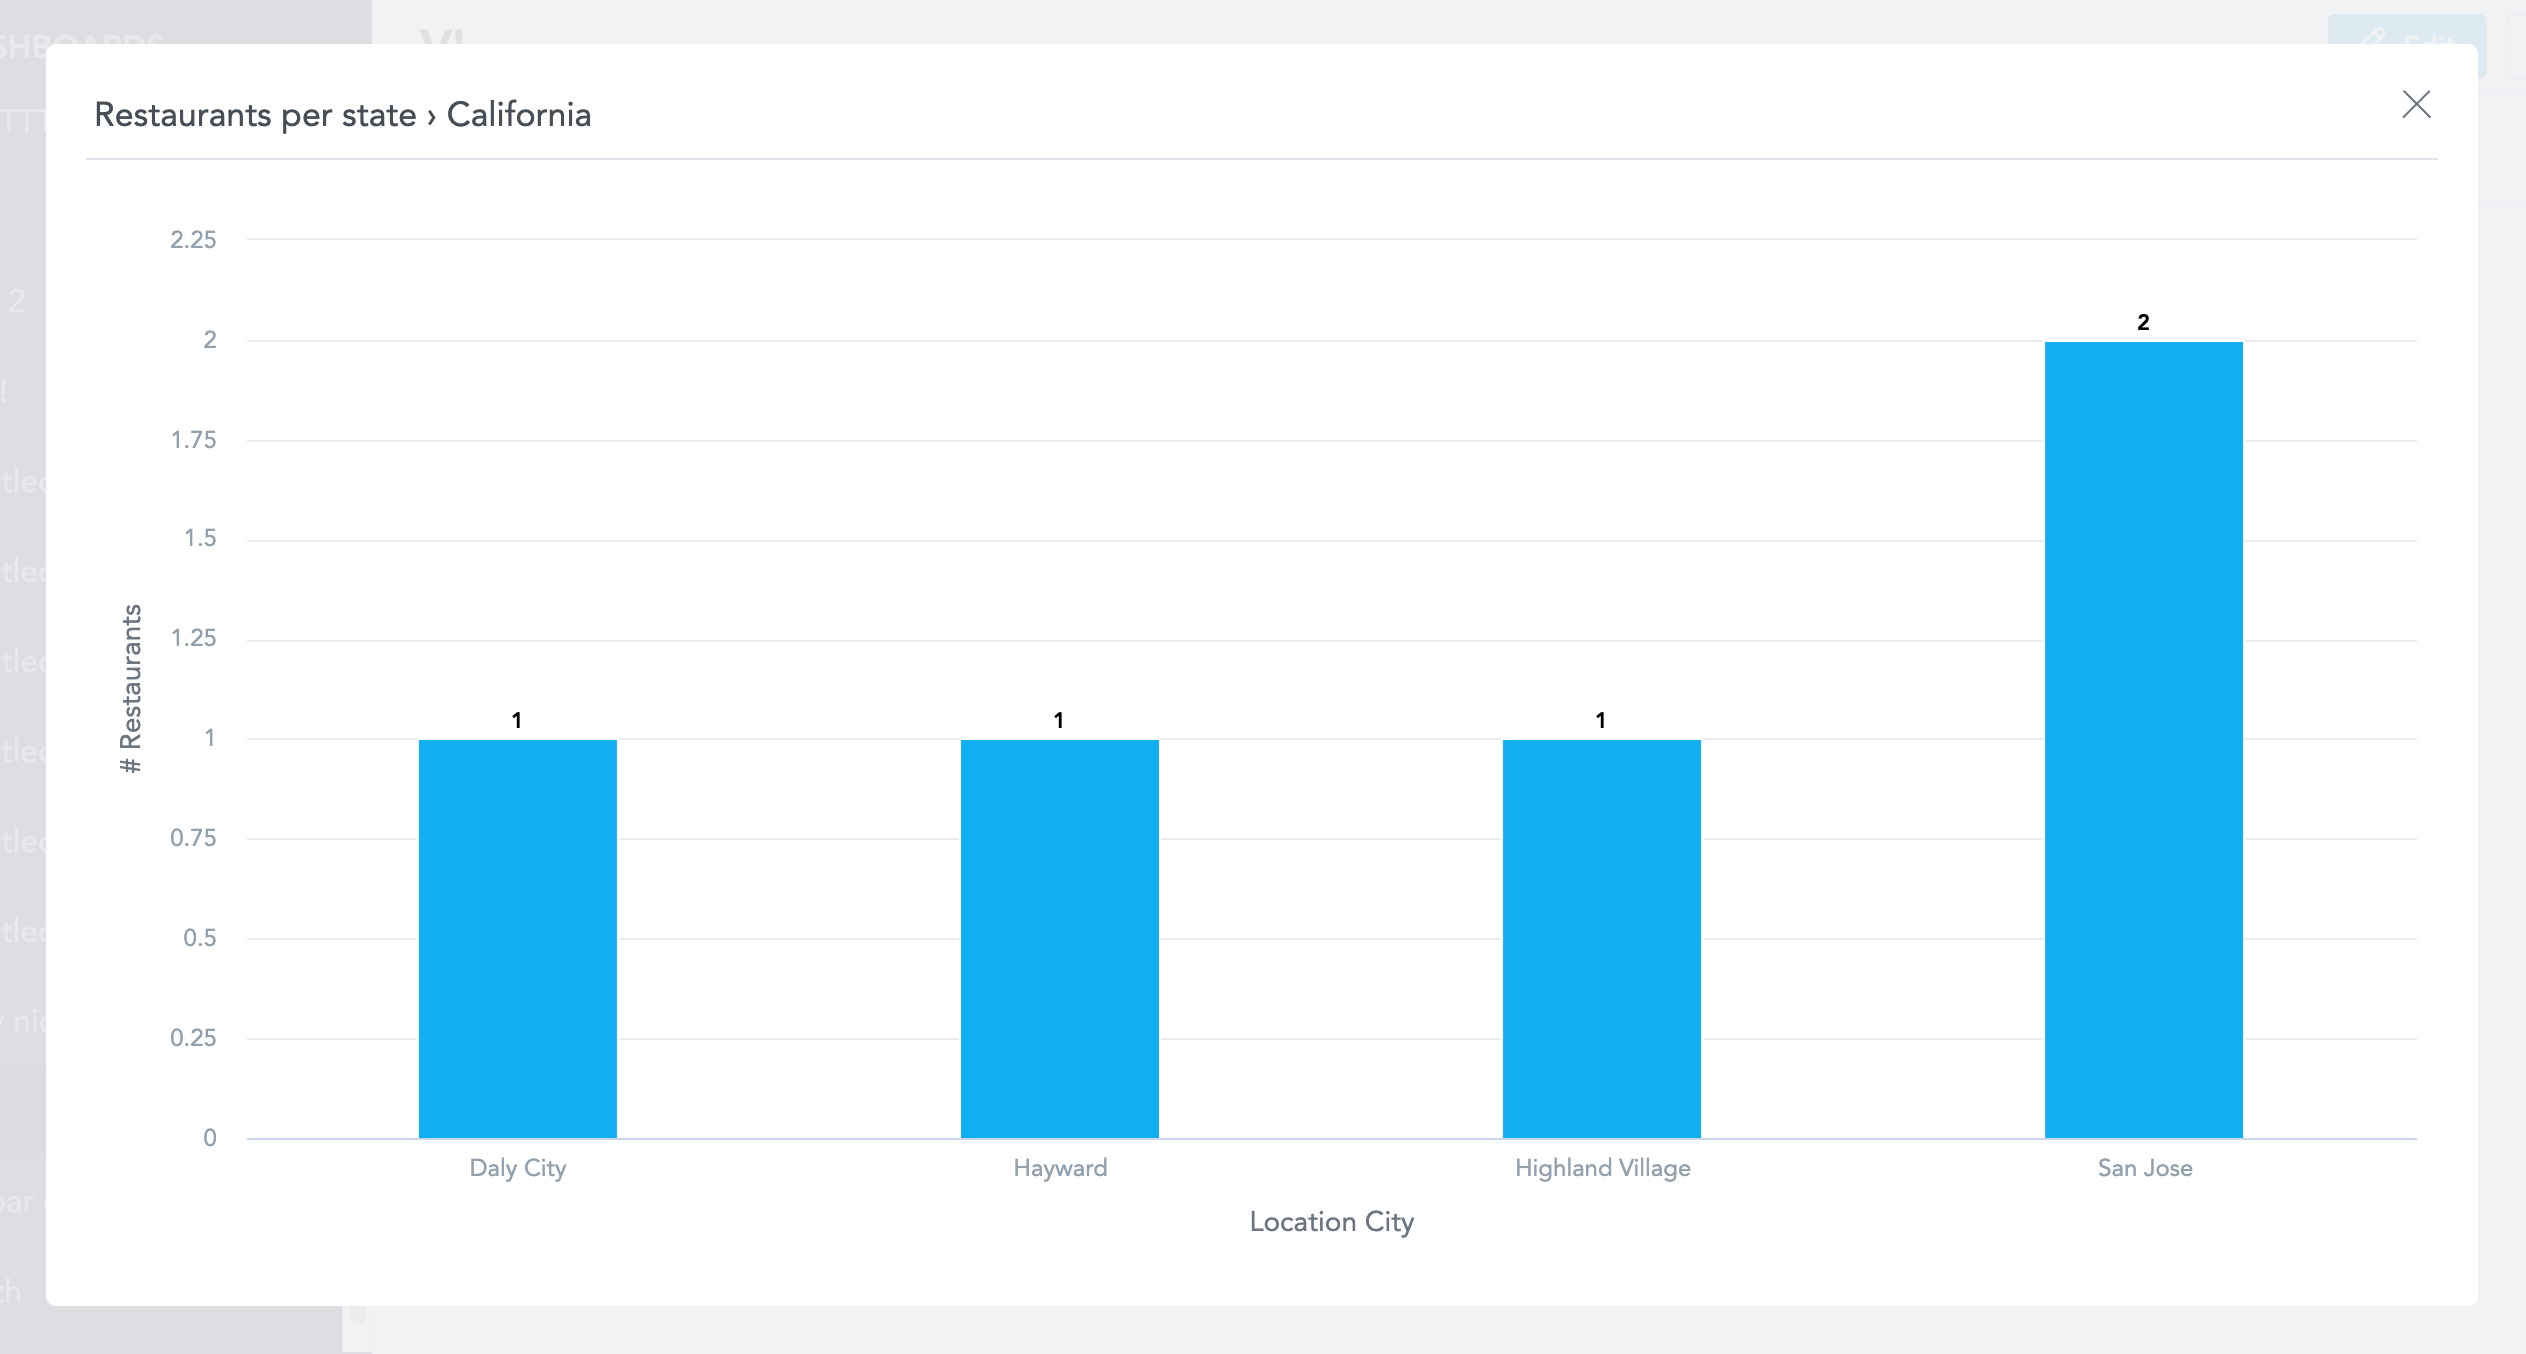
- To see in which cities are the restaurants in California, click the California column.
The dashboard opens a drill window displaying number of restaurants in California viewed by city.
Multiple drill downs
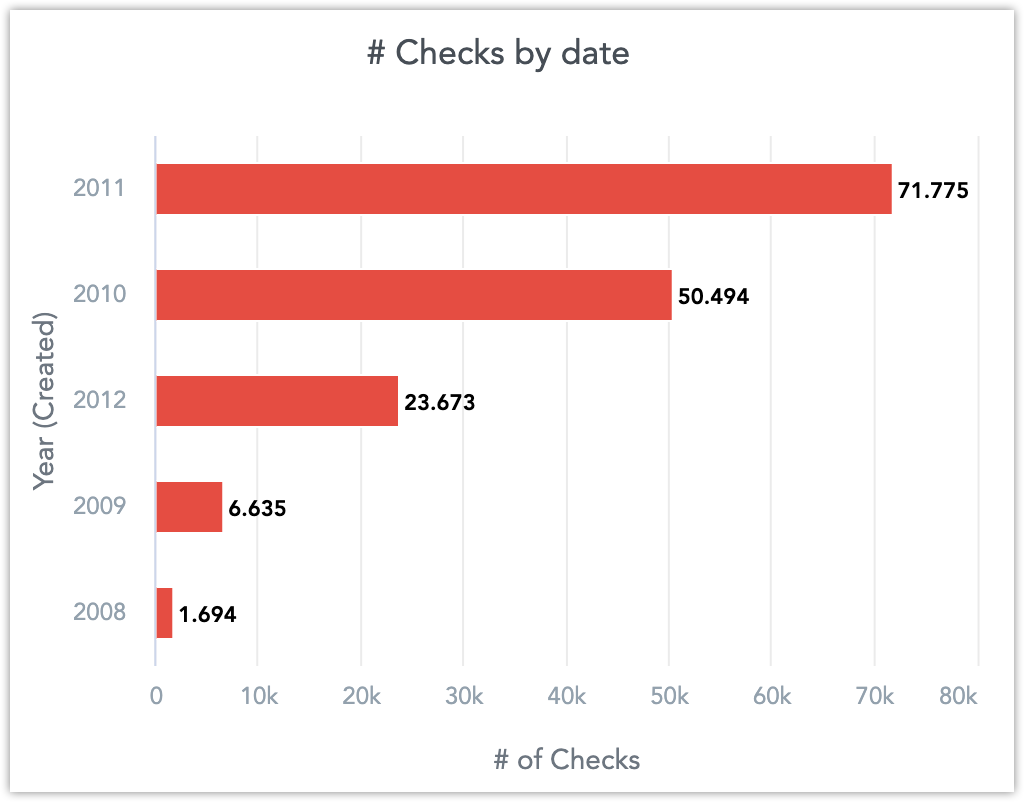
- Create an insight that includes the number of Checks in your restaurants viewed by Year.
- In the Manage section, set the following drill down paths: - Year to Quarter - Quarter to Month - Month to Week - Week to Day
- Add the insight to a dashboard and save the dashboard.
- To see the number of checks broken across quarters in 2011, click the 2011 column. The dashboard opens a drill window displaying number of checks in 2011 viewed by quarter.
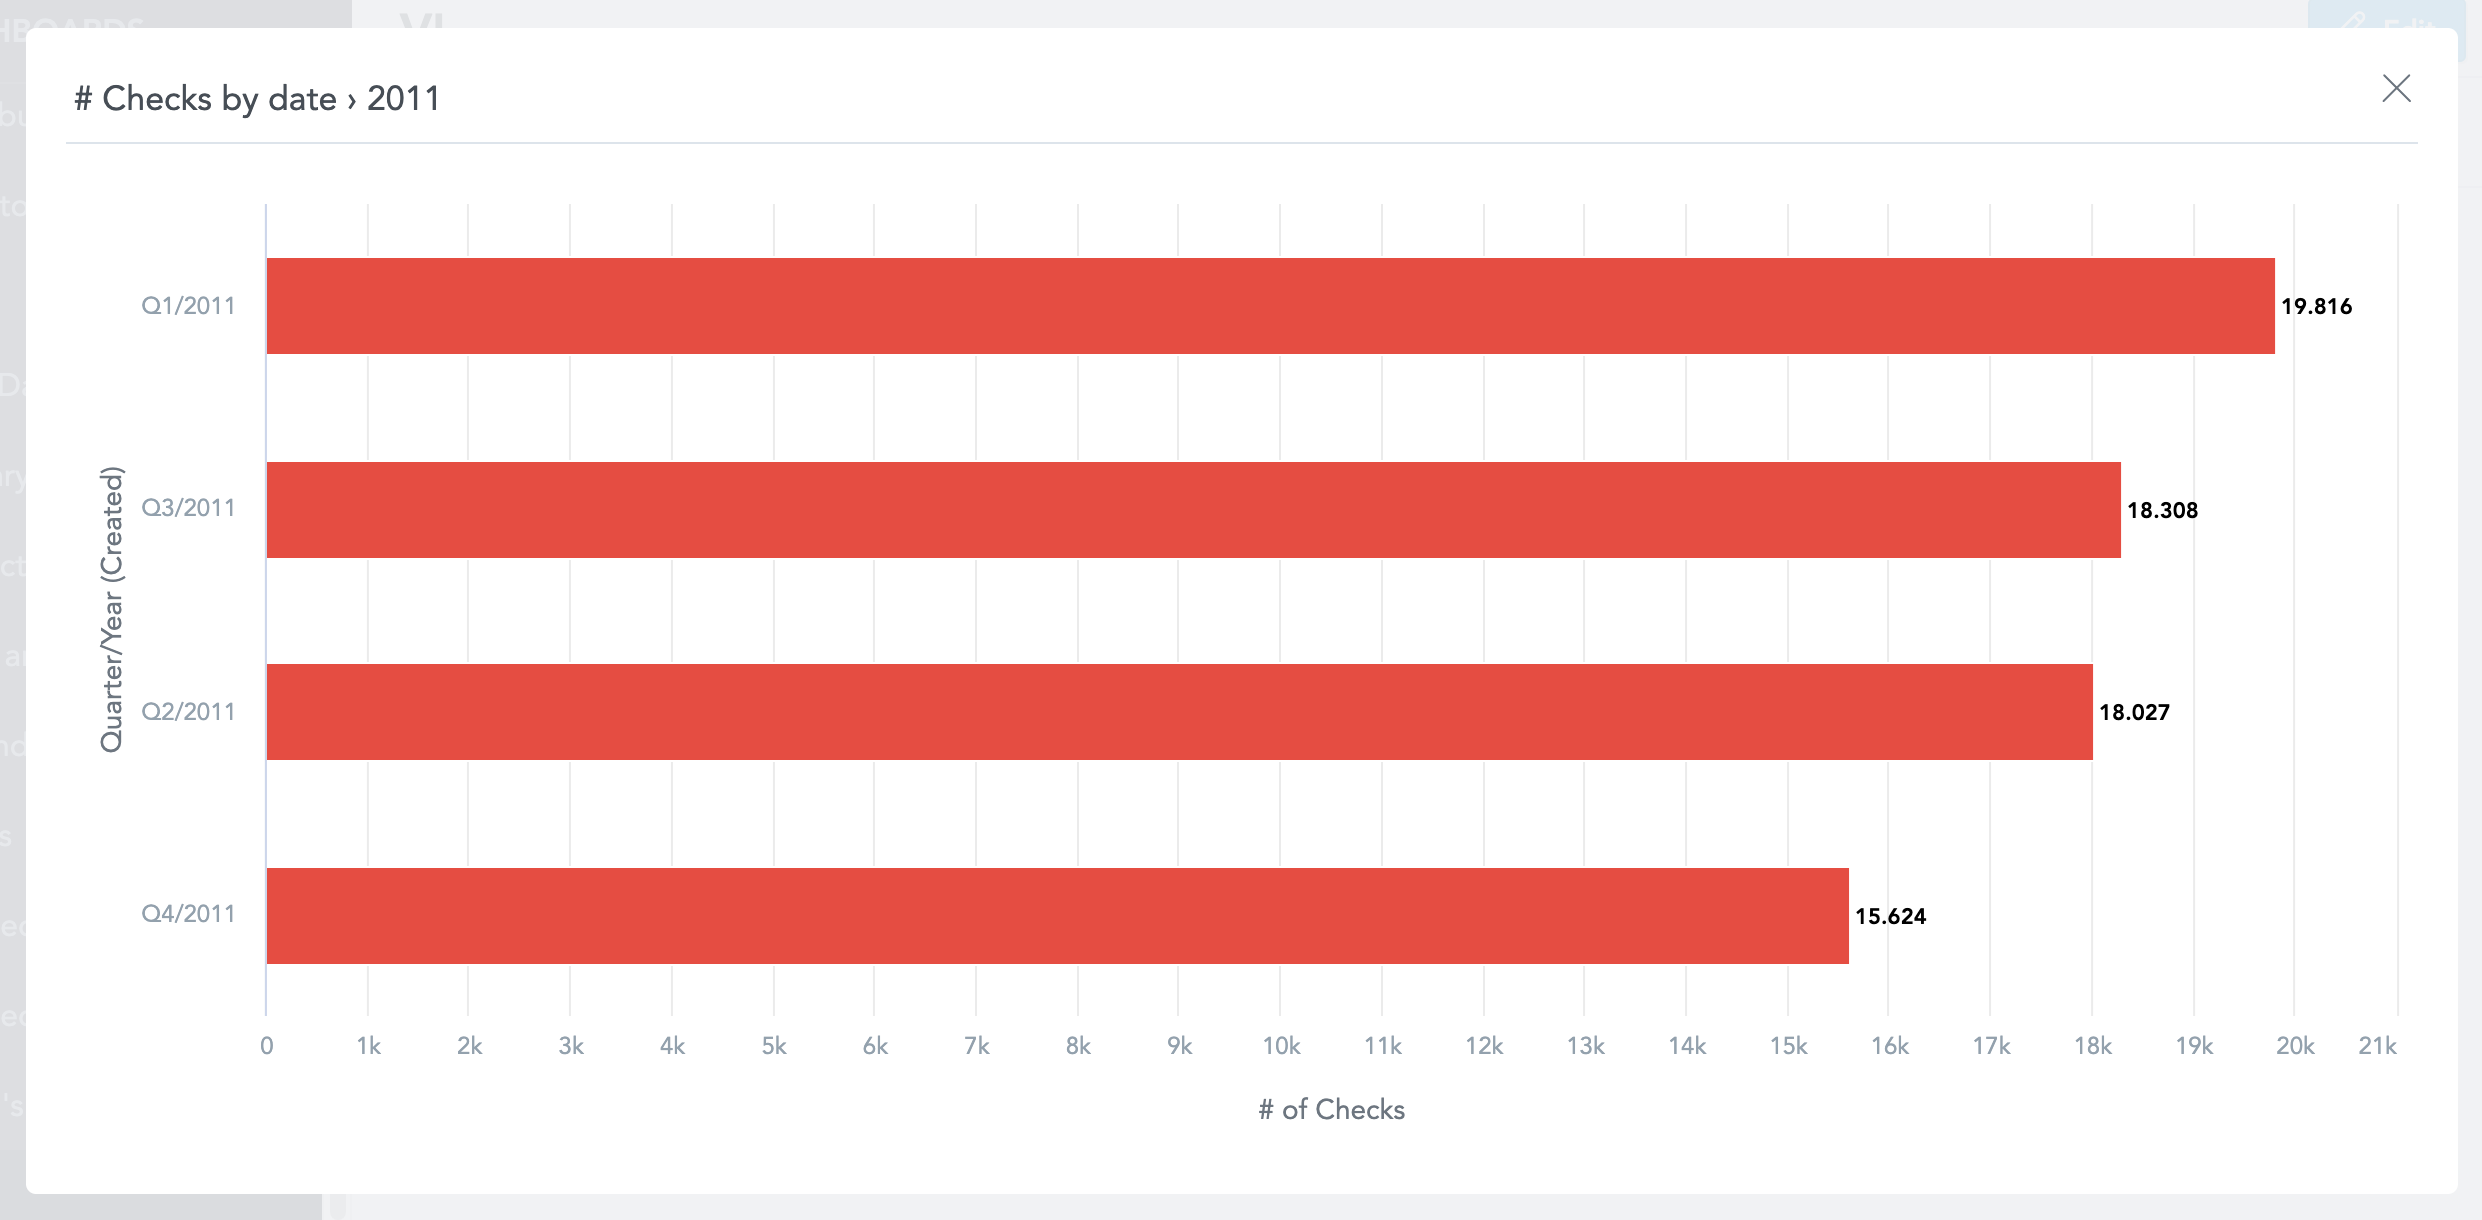
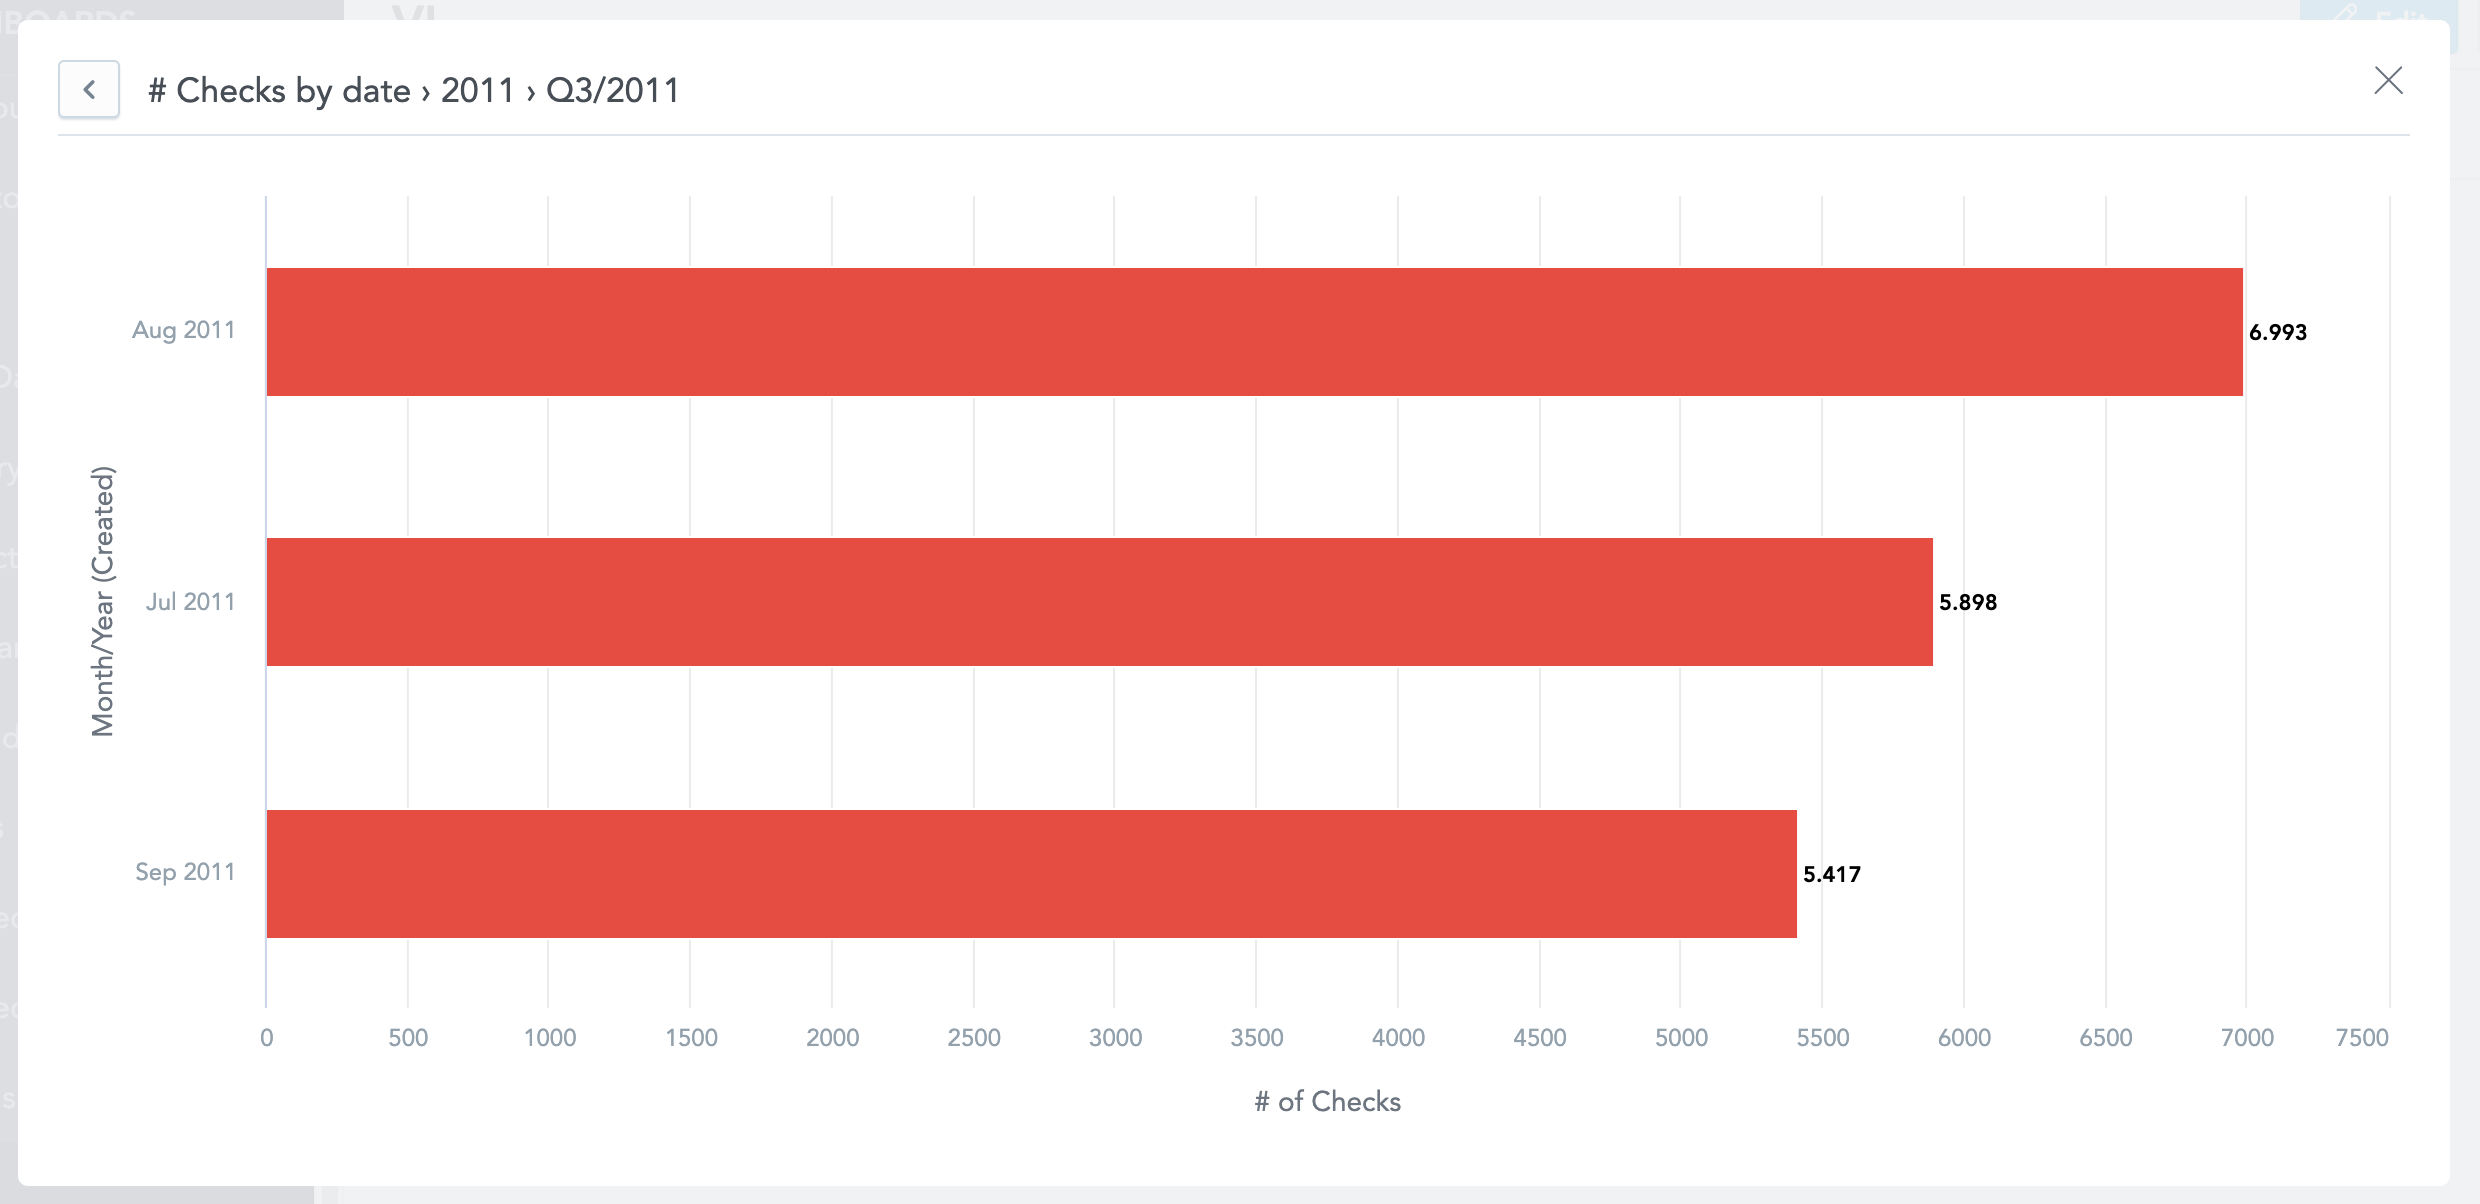
- To see the number of checks broken across months in Q3 in 2011, click the Q3/2011 column. The drill window now displays the number of checks in Q3 in 2011 viewed by month.
You can continue as long as you have drill down paths configured.
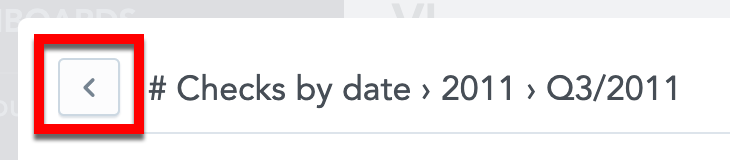
You can use the drill path at the top of the pop-up window.
To go one step back in the drill down, click the arrow button in the drill path.
Multiple types of drilling
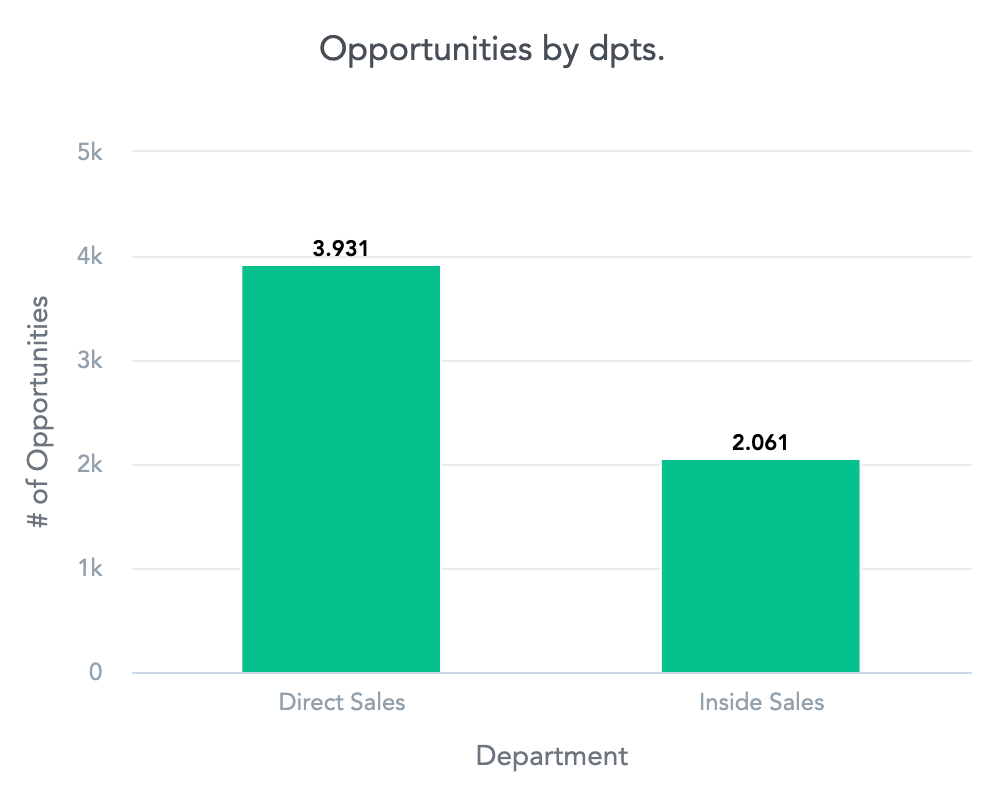
- Create an insight that includes number of Opportunities viewed by Departments.
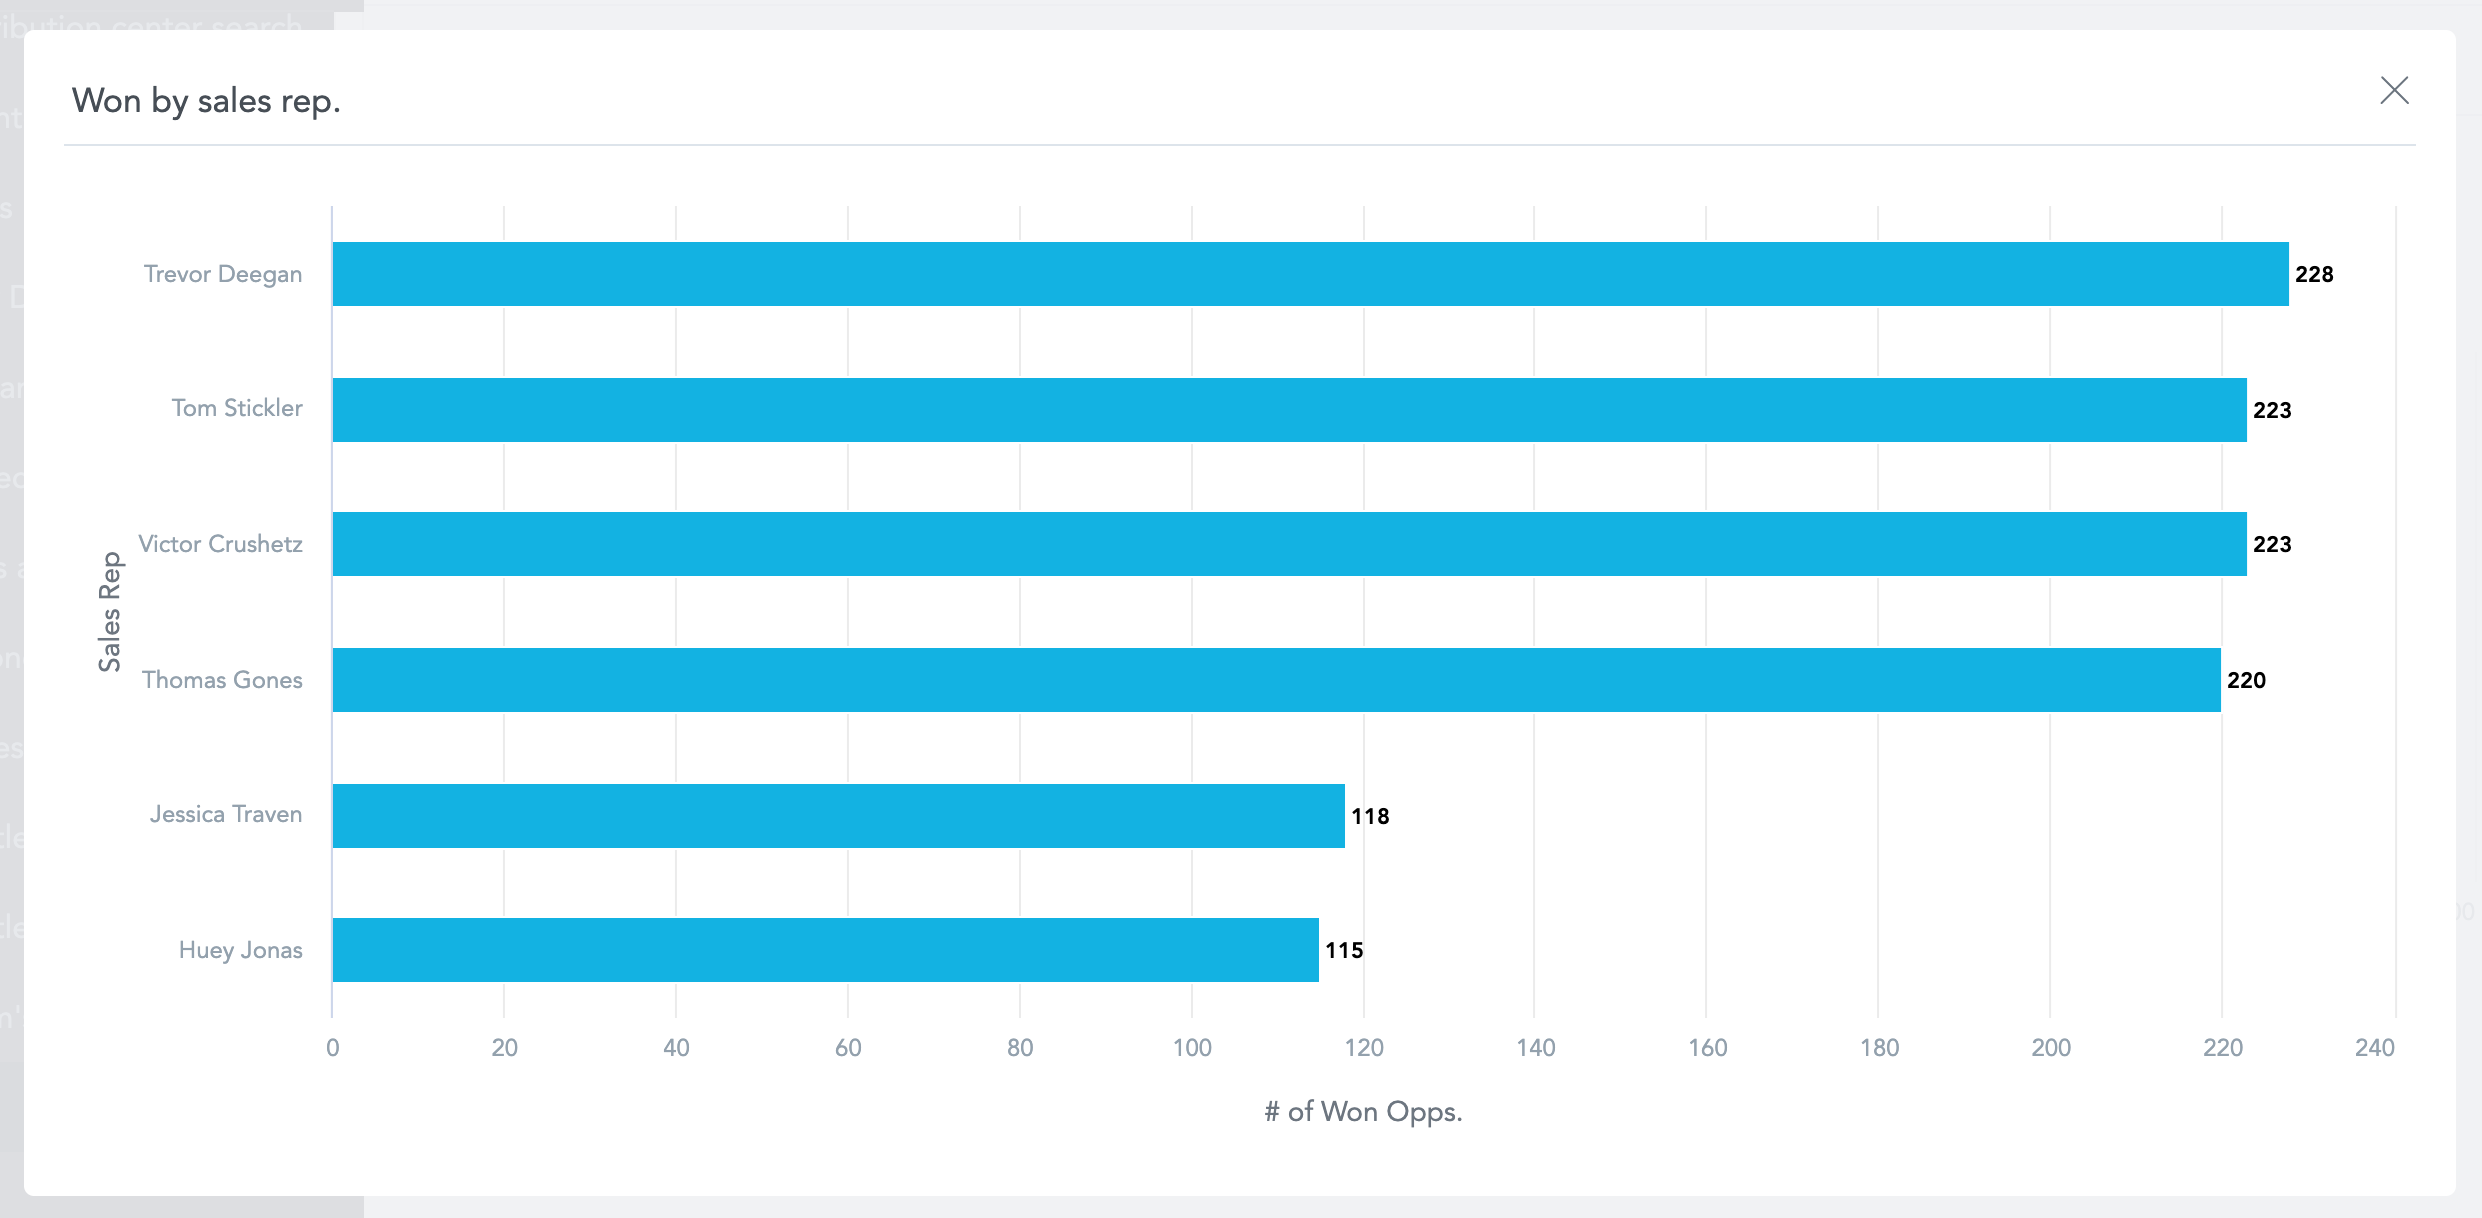
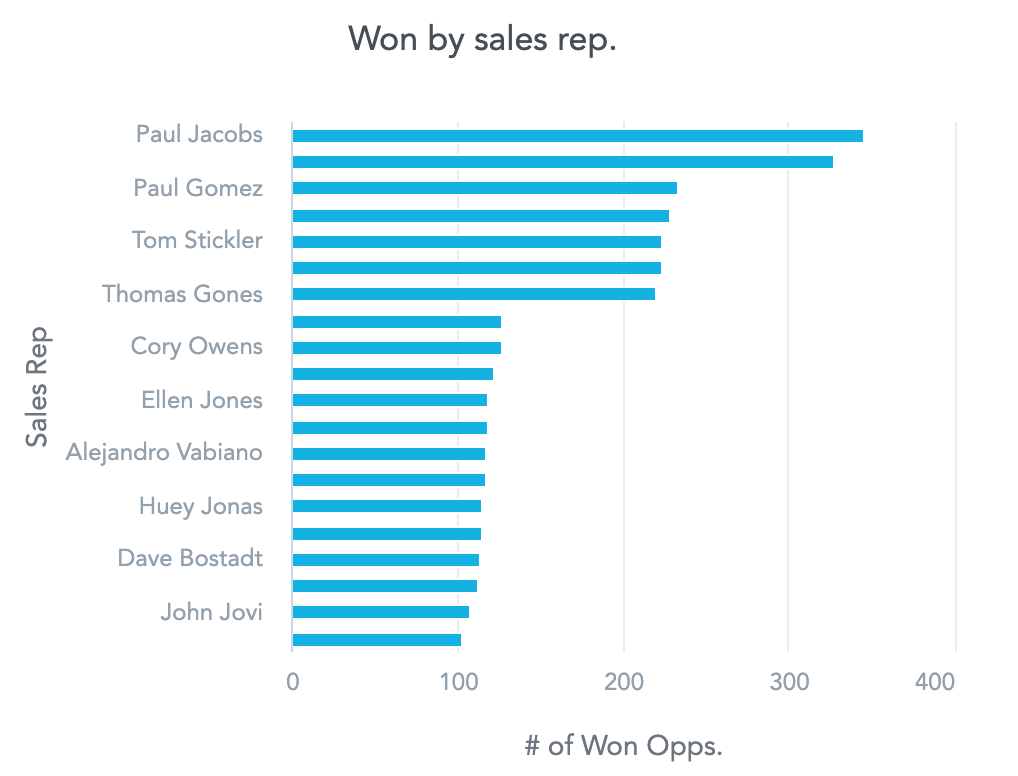
- Create an insight that show number of Won opportunities by Sales representative.
- In the Manage section, set the following: - Department attribute drill down to Sales representative, and - Drill to insight for the Opportunities metric to display the Won opportunities by Sales representative insight. For details, see Drill to Insights from Dashboards.
- Add the insight from step 1 to a dashboard and save the dashboard.
- Click the Direct Sales column to select which drill to use.
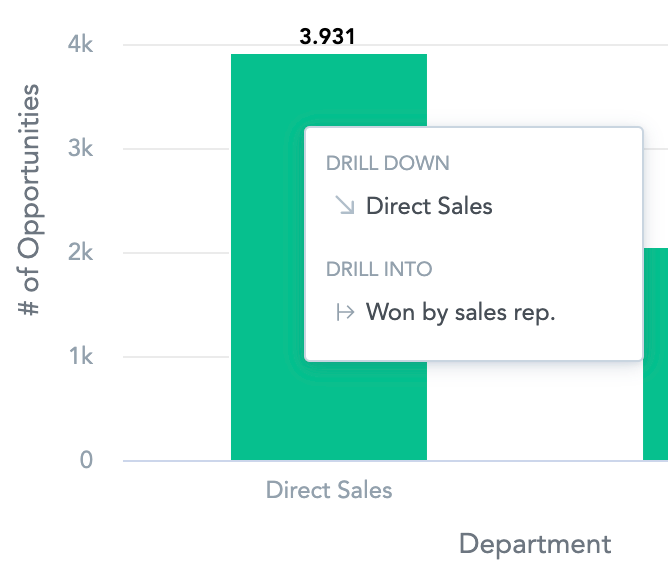
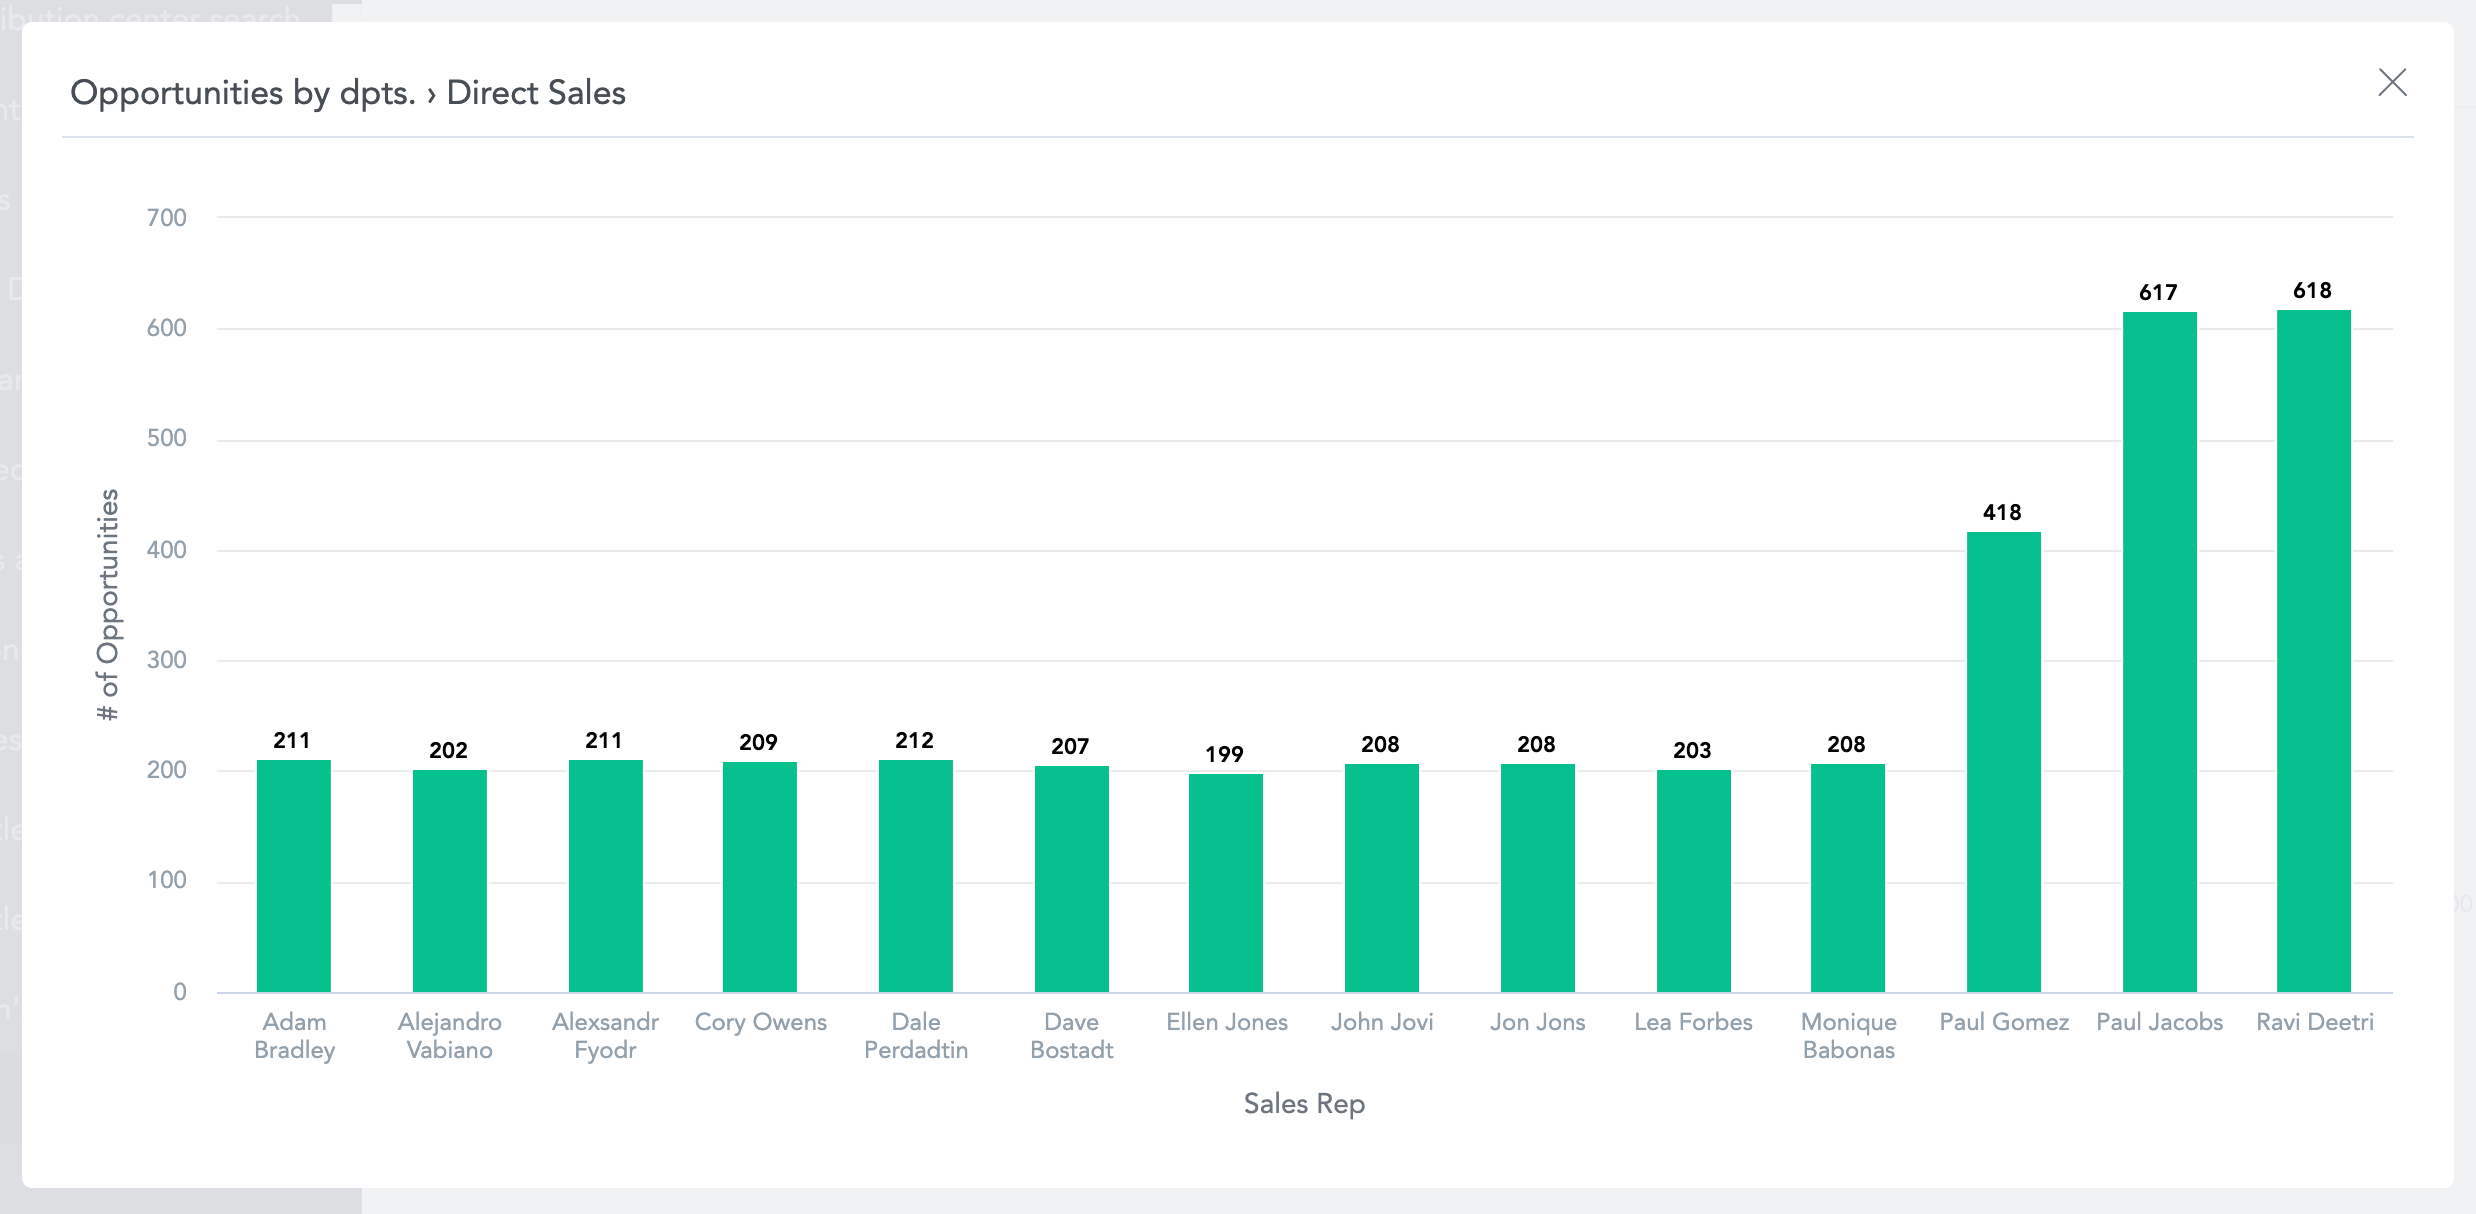
- To see the number of Opportunities broken across Sales representatives in the Direct Sales department, click the option under Drill down.
- To see the number of Won opportunities broken across by the Sales representatives in the Direct Sales department, click the option under Drill into.