You are viewing our older product's guide. Click here for the documentation of GoodData Cloud, our latest and most advanced product.
Gráficos de anillos
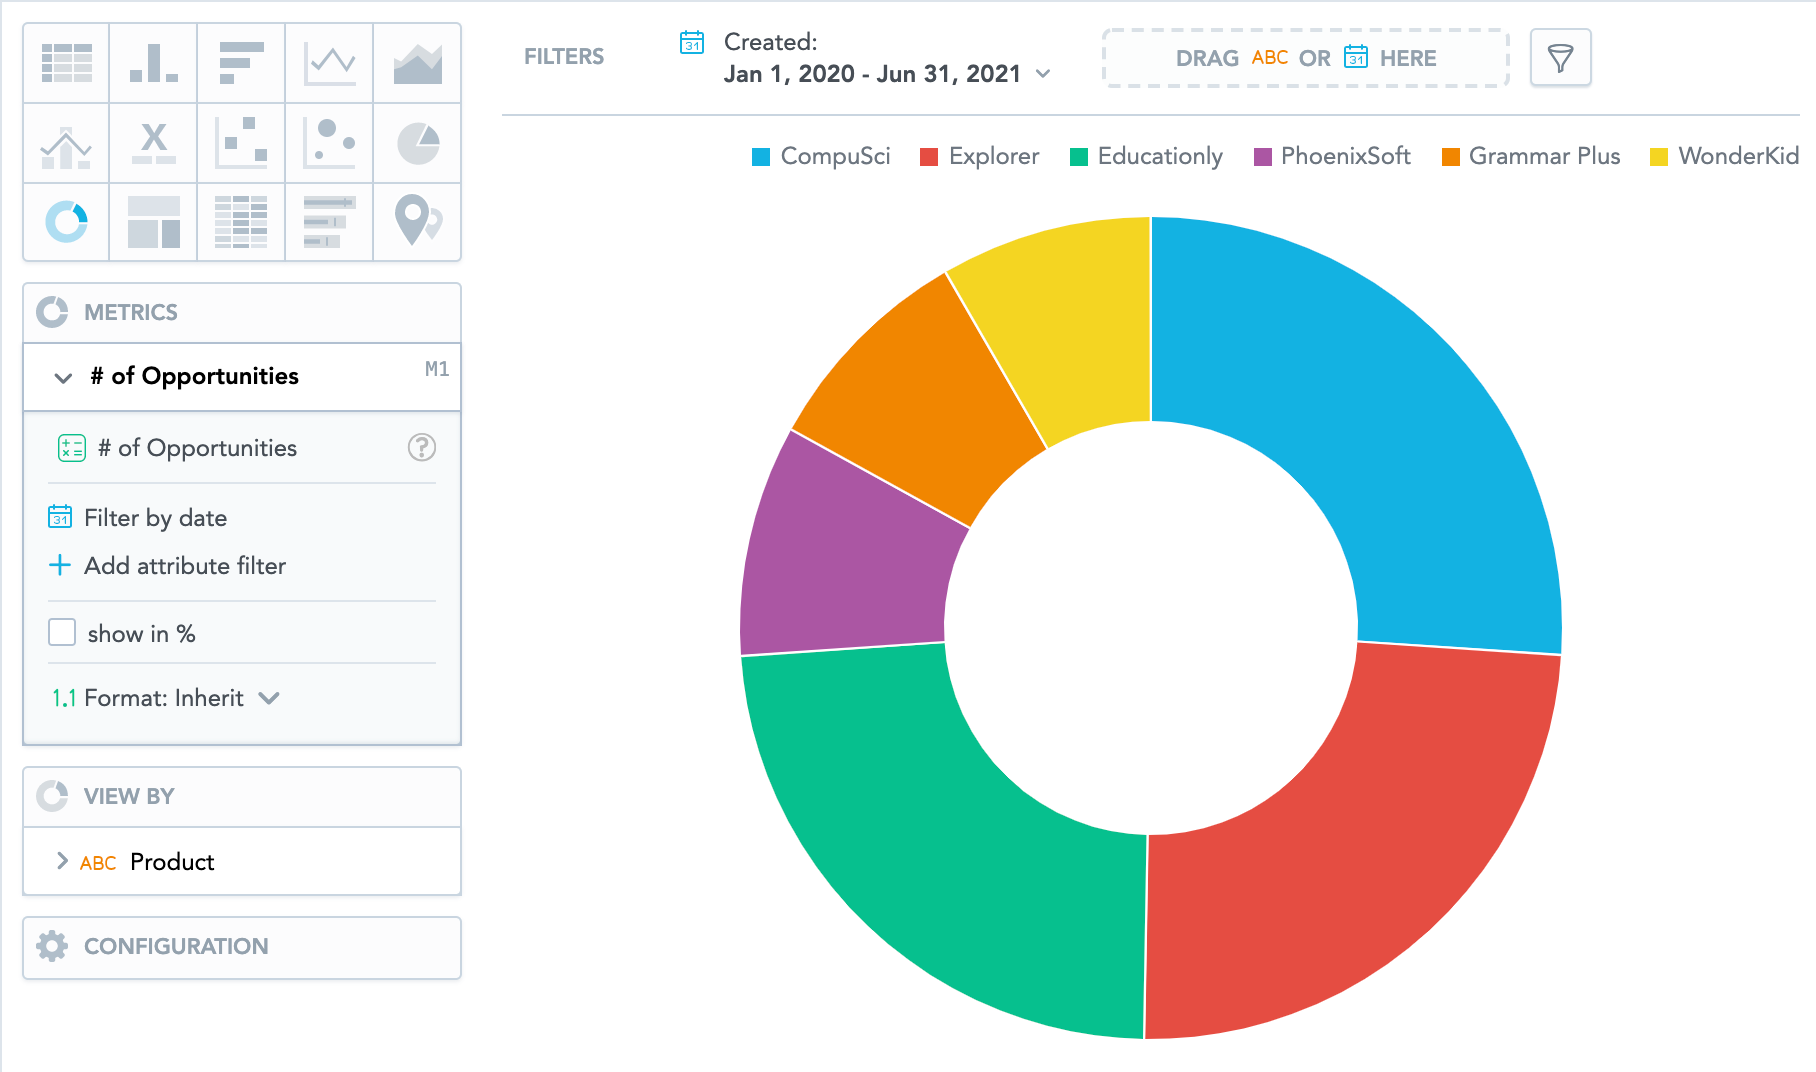
Los gráficos de anillos muestran los datos como segmentos proporcionales de un disco con un agujero en el centro. Los gráficos de anillos se pueden segmentar por diferentes métricas o por un atributo, y permiten a los lectores visualizar las partes que componen un todo.
En los gráficos de anillos también puede:
- Mostrar los valores como un porcentaje. Debe agregar la fecha o un atributo a la sección Ver por.
Para más información sobre los ajustes y las características comunes de todas las perspectivas, vea Tipos de perspectivas.