GoodData Extension Tool for Chrome
The GoodData Extension Tool is available only for the Google Chrome browser.
The GoodData Extension Tool for Chrome lets you access the technical resources (the gray pages, see Access the Gray Pages for a Workspace) with definitions of your workspaces. The Extension Tool and the gray pages linked from it are intended for developers and engineers familiar with the GoodData platform.
The Extension Tool allows you to:
- Make changes to the underlying technical specifications of key workspace elements, such as the logical data model, reports, dashboards, and data load processes.
- Access the interfaces for querying the workspace datastore, browsing workspace-specific storage, applying changes through MAQL, and managing data loading processes.
- Browse the information from the log files presented in a user-friendly format.
Not every GoodData platform feature referenced in this article is available for all pricing plans. If you cannot click the link, it means that the content is outside of your pricing plan’s scope. To learn more how to work with GoodData documentation, see Find Documentation for Your GoodData Plan.
In GoodData, terms workspace and project denote the same entity. For example, project ID is exactly the same as workspace ID. See Find the Workspace ID.
Features that are marked as Lab or Labs require the GoodData Labs application enabled for your particular domain.
Main Features
The Extension Tool provides the following features:
- The Toolbar displays links to various GoodData resources (see Toolbar).
- The Overlay provides basic information about the current workspace (see Overlay).
- The Metadata Tools allow you to access and browse the metadata (see Metadata Tools).
- The Log Parser extracts and displays information from the Data Integration Console log files (see Review a Log of Data Load Execution) in a user-friendly format (see Log Parser).
- The Configuration allows you to modify the way how the Extension Tool behaves (see Configuration).
The Extension Tool allows you to make changes to one workspace at a time. If you need to apply changes across multiple workspaces, we recommend that you use the GoodData APIs (see API Reference).
How the Extension Tool Interacts with the GoodData Legacy
The Extension Tool itself does not make any changes to the workspace. It only provides links to the resources and gathers information from the GoodData APIs with non-destructive calls.
The interfaces available through the Extension Tool provide technical access to all areas of a workspace including its metadata, the logical data model, and loaded datasets. No data validation is performed within these interfaces. Improper use may lead to damaging the workspace. In most cases, the changes cannot be undone.
Where possible, use the official GoodData tools such as the LDM Modeler (see Data Modeling in GoodData) or the GoodData Portal (see GoodData Portal) for interacting with your workspaces.
Before you execute any changes, verify that you have selected the correct workspace first. To do so, you can use the Overlay.
Install the Extension Tool
To download the Extension Tool, get it from the Chrome Web Store.

During the installation, the Extension Tool will ask for permissions to access the default GoodData hostname, https://secure.gooddata.com/. If you have a custom hostname on the GoodData platform, you have to manually enable the Extension Tool to access it.
Make the Extension Tool Icon Permanently Visible in the Toolbar
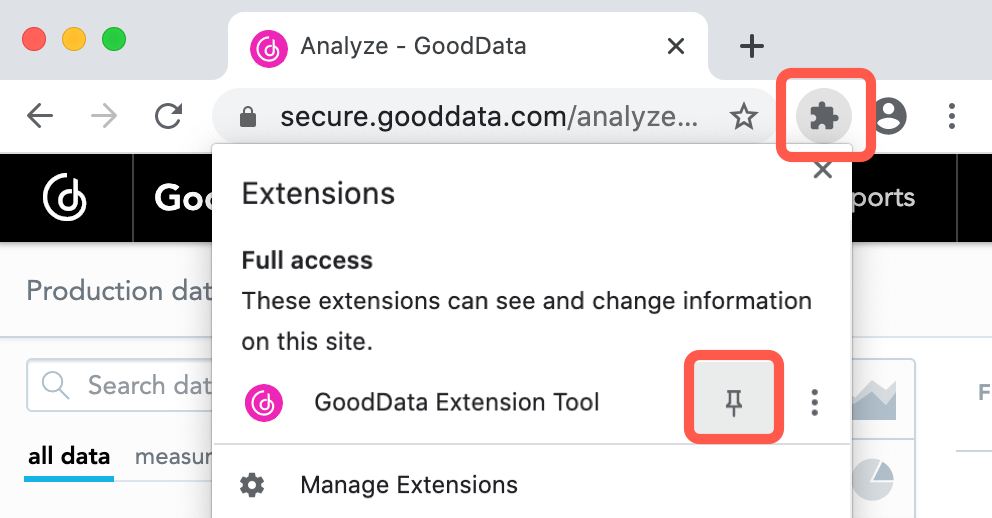
By default, all installed browser extensions are hidden from the toolbar and are accessible from the default extension icon. You can pin the Extension Tool icon to the browser toolbar to make it permanently visible.
Steps:
- Click the default extension icon in the browser toolbar, and then click the pin icon next to GoodData Extension Tool. The Extension Tool icon appears in the toolbar.
- (Optional) If you have multiple extensions pinned, re-order them by dragging and dropping the icons within the toolbar.
Enable the Extension Tool for Your Hostname
If you have a custom hostname on the GoodData platform (different from the default one, https://secure.gooddata.com/), the Extension Tool will be inactive after the installation, and its toolbar icon will be grayed out.
You have to manually enable the Extension Tool to be able to access your hostname.
Steps:
Access your hostname from the Google Chrome browser, and log in.
Click the Extension Tool icon in the browser toolbar. A popup dialog appears warning you that the Extension Tool is not enabled.
If the Extension Tool identifies that your currently logged-in GoodData user is a domain administrator for the domain with your hostname, it associates the domain with this hostname and unlocks some domain administrator-only links.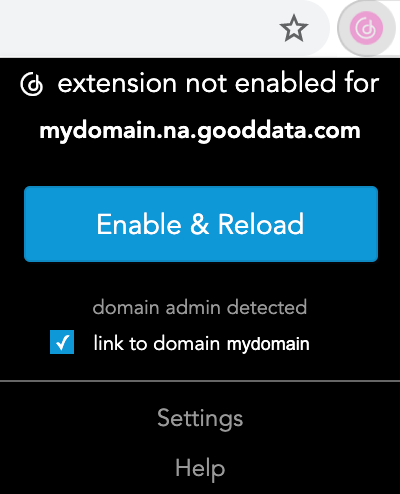
Click Enable & Reload. You are asked to grant the Extension Tool permissions to access your domain.
Due to a known issue in the Google Chrome browser, the permission request popup might not appear after clicking Enable & Reload if you have some Chrome windows minimized. This issue appears in Linux and macOS operating systems. If the permission request popup does not appear, open the minimized windows to display the popup.Approve the permission request. The page reloads. The Extension Tool icon becomes enabled. You can now use the Extension Tool on your domain.
Any time later, you can manually enable the Extension Tool for other hostnames.
Configure the Extension Tool
While the default configuration of the Extension Tool covers main usage scenarios, consider enabling the following configuration options for better usability:
Open the Extension Tool Tutorial
After you have installed the Extension Tool and opened the Toolbar for the first time, an interactive tutorial opens to guide you through functionality and navigation of the Toolbar.
To open it any time later, click the ▷ icon.
![]()
Toolbar
The Toolbar displays links to various GoodData resources.
Most of the links open the gray pages. The gray pages are a form-based web interface that allows you to interact with the GoodData APIs, review technical definitions, and in some cases make changes to those definitions (see Access the Gray Pages for a Workspace).
Some Toolbar links are:
- Context-specific and depend on your current location within GoodData. Different links may become available depending on whether you are within a workspace, a metadata object, a report and so on.
- Role-specific and are available only when you are accessing a workspace where you are an administrator (see User Roles) or a domain administrator for the workspace’s domain.
To display the Toolbar, click the Extension Tool icon in the browser toolbar.

The Toolbar groups the links by tabs on the bottom.
- To navigate through the links, hover over a tab, which will open the links grouped behind this tab.
- To pin a tab and have its links visible all the time, click the tab. The pinned tab gets underlined. To unpin the tab, click it again, or click another tab to pin it instead.
GD logo
Opens the GoodData Portal (see GoodData Portal) and takes you to the currently selected dashboard (a pixel-perfect dashboard or a Dashboard) for the workspace.
Use this icon to quickly return to the GoodData Portal from any gray page.
Workspace

New
Opens the gray page where you can create a new workspace. To do so, you must have the authorization token (see Create a Workspace).
List
Opens the gray page that lists all the workspaces that you have access to.
Info
Opens the top-level gray page for the current workspace with basic workspace properties.
Model
Opens the logical data model (LDM) of the workspace for viewing and editing in the LDM Modeler (see Data Modeling in GoodData).
Export
Opens the gray page where you can export the complete workspace. You can then import it into an empty workspace and get a clone of the exported workspace (see Clone a Workspace).
After the export process completes, copy the value of the generated token and save it for later. You are going to use it when importing the exported workspace into an empty workspace. To open the gray page for importing a workspace, use the Import link.
You can import a complete workspace only into an empty workspace that does not contain any metadata.
Import
Opens the gray page where you can import a complete workspace exported earlier (see Export) into the current workspace. Your current workspace will become a clone of the exported workspace (see Clone a Workspace). To specify the exported workspace, use the token that was generated during the export.
Your current workspace must be empty and must not contain any metadata.
If your workspace has some metadata:
- To make changes to the logical data model (LDM), use the LDM Modeler (see Update a Logical Data Model).
- To add metrics, reports, or dashboards from another workspace, export those objects from that workspace (see MD Export) and then import them into your workspace (see MD Import).
Labs Clone
Opens a page in the experimental GoodData Labs application where you can clone the workspace. It exports the complete workspace, creates a new empty workspace and imports the imported workspace into the newly created one.
All links in the extension marked as “Labs” use features under the GoodData Labs. Based on your configuration, some or all of these may not be available to you or your users.
Config
Opens the gray page where you can review and modify platform settings on a workspace level (see Configure Various Features via Platform Settings).
Metadata

Metadata
Opens the gray page with links to the workspace metadata (metrics, reports, and dashboards that have been built in or imported into the workspace), the logical data model objects (datasets, facts, attributes, attribute labels), and other objects that have been created or referenced in the workspace.
Query
Opens the gray page with links to specific types of metadata in the workspace.
Identifiers
Opens the gray page where you can convert object identifiers to object URIs and vice versa.
MD Export
Opens the gray page where you can export some metadata objects from the workspace. You can then import them into another workspace.
Objects are exported in a cascade. For example, if you are exporting a dashboard, all the reports and metrics used in that dashboard will also be exported.
After the export process completes, copy the value of the generated token and save it for later. You are going to use it when importing the exported metadata into another workspace. To open the gray page for importing metadata objects, use the MD Import link.
For more information about exporting and importing metadata, see Migrate Selected Objects between Workspaces.
MD Import
Opens the gray page where you can import the metadata objects exported earlier (see MD Export) into the current workspace. To specify the exported metadata objects, use the token that was generated during the export.
For more information about exporting and importing metadata, see Migrate Selected Objects between Workspaces.
- Keep the checkboxes as they are. Different modes are not supported.
- The metadata objects exported from the source workspace overwrite the versions of those objects in the target workspace where they are being imported into. Objects are exported in a cascade. For example, if you are exporting a dashboard, all the reports and metrics used in that dashboard will also be exported.
- The logical data model (or at least the part that is affected by the imported metadata objects) must be the same in both workspaces. Importing metadata objects into a workspace does not make any changes into the logical data model of this workspace. If you need to update the logical data model in the target workspace, do so before importing the metadata objects into this workspace using the LDM Modeler (see Update a Logical Data Model), API, Life Cycle Management tools (see Rollout Brick), or MAQL DDL.
Dates
Opens the gray page where you can upload a custom calendar into one or more date dimensions and migrate older date dimensions to the new date dimension templates (see Manage Custom Date Dimensions).
Localization
Opens the gray page where you can export and import an XLIFF file containing strings translated into a selected language (see Metadata Localization).
Object

Explain
This link is available only when you are viewing a report, insight, or a metric object.
- For reports and insights, opens the gray page with a diagram depicting a tree of logical operations that describe how the currently selected report or insight is calculated.
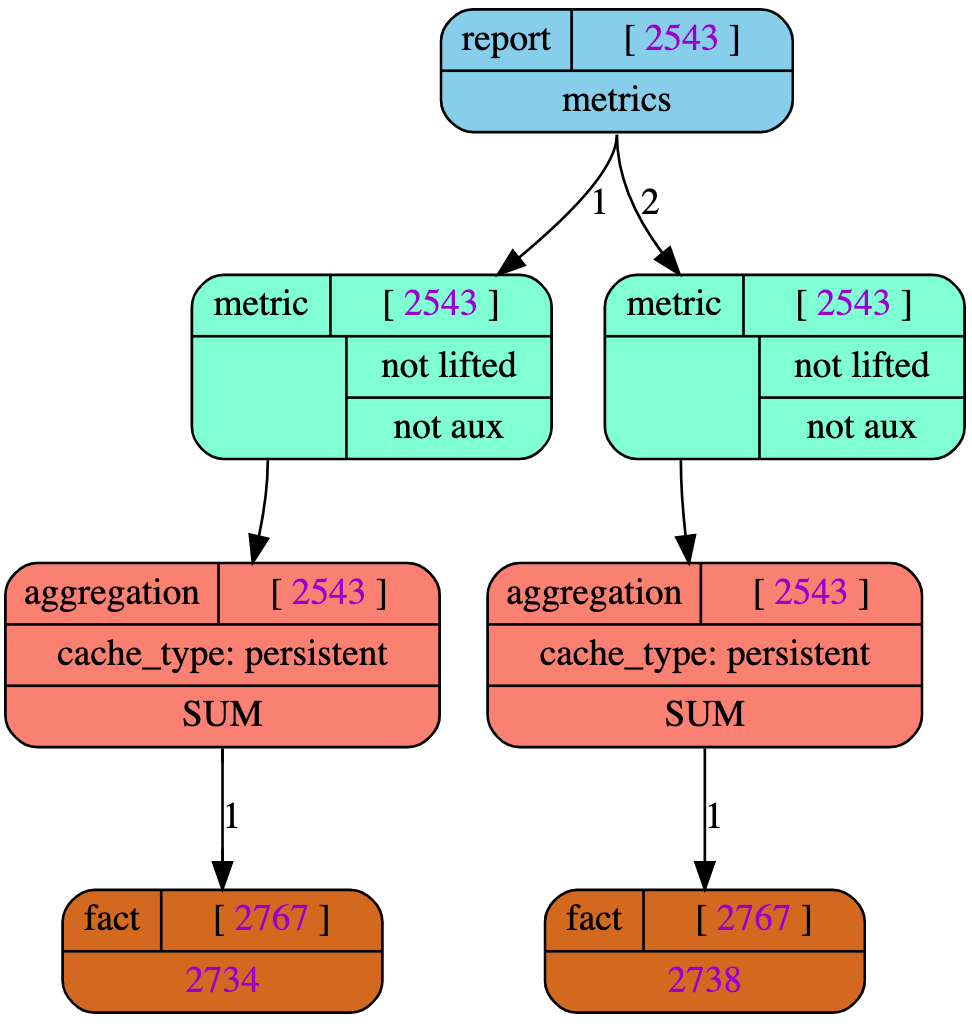
- Hover over an object ID to see the object name.
- Click an object ID to open the gray page for this object.
- For metrics, opens the gray page with a diagram depicting a tree of nested metrics where you can calculate a sample with intermediate results.
You can use this link for debugging reports, insights, and metrics.
Object
This link is available only when you are viewing a particular object in the GoodData Portal (see GoodData Portal) or through the gray pages.
Switches between the GoodData Portal and the gray page for a metadata object such as:
- Dashboard
- Insight
- Pixel-perfect dashboard
- Pixel-perfect report
- Attribute, attribute label, fact, and metric
- Folder
If you click this link while being on the GoodData Portal page for a particular object, you will be redirected to the gray page for this object.
If you click this link while being on the gray page for a particular object, you will be redirected to the page within the GoodData Portal for this object. However, this link may not be available for some types of objects.
Used
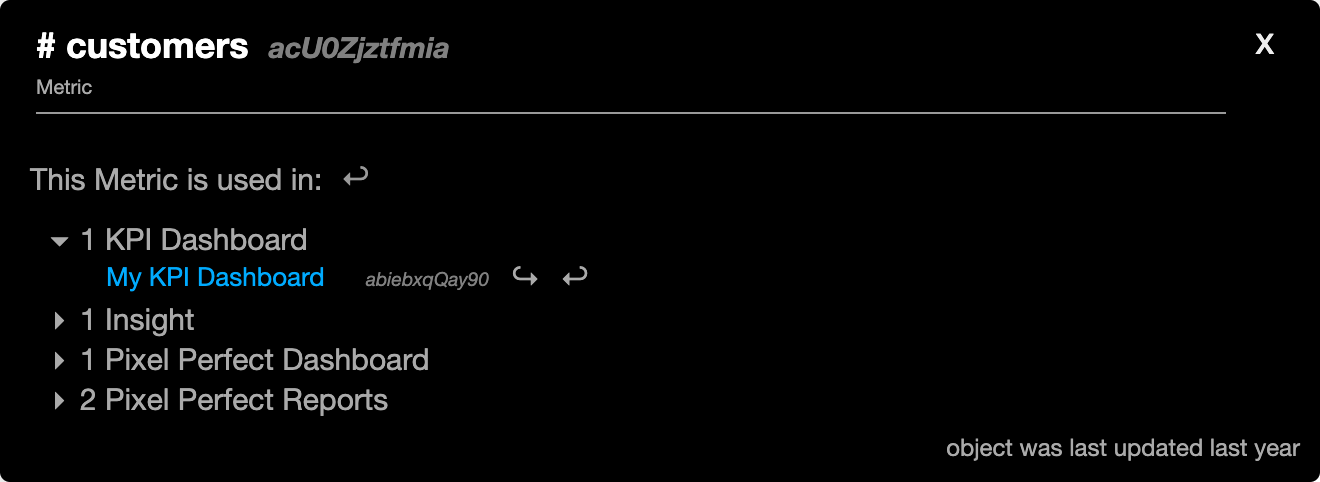
This link is available only when you are viewing a particular metadata object (such as a report, an insight, a metric, and so on).
For a metadata object, opens a popup dialog that shows what other objects use this metadata object. For example, for a metric, the dialog would show what insights, dashboards, or other metrics use this particular metric (see Discovering Object Dependencies).
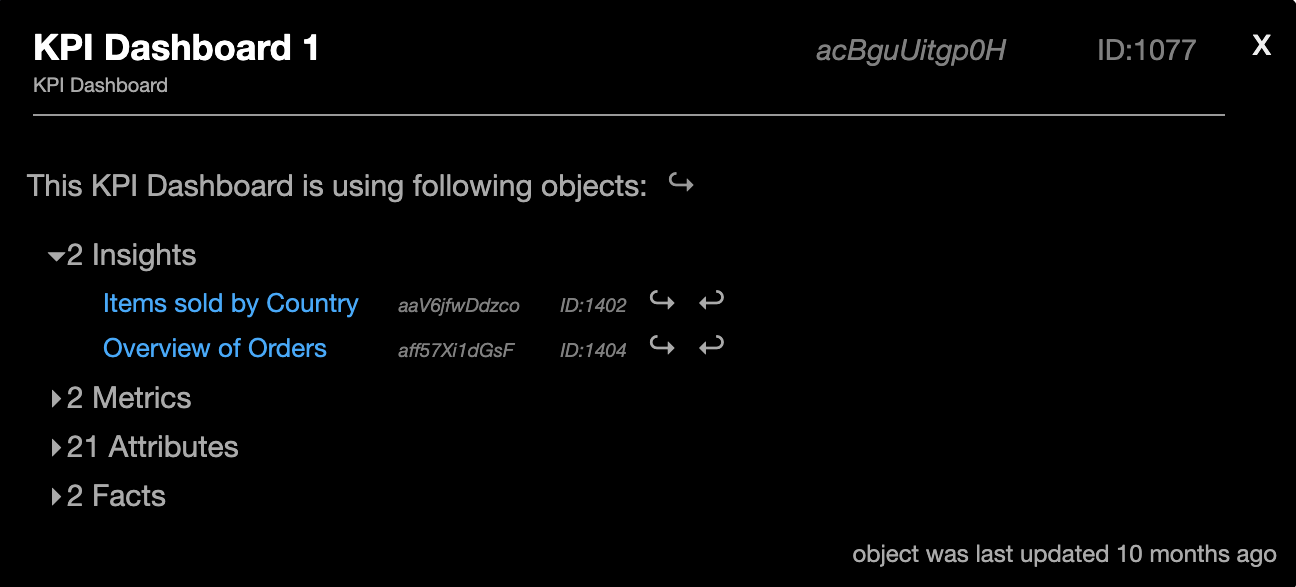
Using
This link is available only when you are viewing a particular metadata object (such as a report, an insight, a metric, and so on).
For a metadata object, opens a popup dialog that shows what other objects this metadata object uses. For example, for a metric, the dialog would show what attributes and other metrics this particular metric uses (see Discovering Object Dependencies).
Validate
Opens the gray page where you can perform technical validation of the workspace (see Validate a Workspace).
Labs Filters
Opens a page in the experimental GoodData Labs application where you can manage data permissions (see Data Permissions).
Edit
Opens the gray page of the metadata object in the edit mode that allows you to directly modify its JSON definition.
This is a low-level access and improper use may lead to damaging your workspace.
DDL
Opens the gray page where you can execute MAQL DDL commands to update the logical data model of the workspace (see MAQL DDL).
DML
Opens the gray page where you can execute MAQL DML commands to remove some data from a dataset (see Deleting Records from Datasets).
Data Load

DISC
Opens the main page of the Data Integration Console where you can check data load status for all your workspaces (see Accessing Data Integration Console).
Processes
Opens the gray page where you can review the data load processes deployed in the current workspace.
While this page allows you to deploy a new data load process to the workspace, we recommend that you rather do that from the Data Integration Console. To open the Data Integration Console, use the Schedules link.
Service
Opens the Data Integration Console for the service workspace if you have any. The service workspace is a technical workspace that is used in different GoodData components for specific purposes and usually does not contain any data.
For example, you use the service workspace:
- In Life Cycle Management (LCM) - to deploy and run LCM bricks at the domain level (see How to Use a Brick)
- In Automated Data Distribution (ADD) v2 - to deploy and run ADD v2 data load processes (see Set Up Automated Data Distribution v2 for Data Warehouses and Set Up Automated Data Distribution v2 for Object Storage Services)
- In the data preparation and distribution pipeline - to deploy and run the pipeline bricks such as CSV Downloader, ADS Integrator, and so on (see Data Preparation and Distribution Pipeline)
This link is available only when the service workspace is associated with the current hostname in the Extension Tool.
If the service workspace is not associated with the hostname in the Extension Tool, this link is grayed out and dashed-underlined. To associate the service workspace with the hostname, click the underlined link, and specify the workspace ID (the ID of the current workspace is pre-populated). You can also associate the service workspace with the hostname in the configuration of the Extension Tool.
Schedules
Opens the Data Integration Console where you can review the data load processes deployed in the current workspace and process schedules.
Here, you can deploy a new data load process to the workspace or schedule a deployed process (see Scheduling a Process).
Schedules~GP~
Opens the gray page where you can review the schedules created for the data load processes deployed in the current workspace.
While this page allows you to create a new schedule for a deployed process, we recommend that you rather do that from the Data Integration Console (see Scheduling a Process). To open the Data Integration Console, use the Schedules link.
Output Stage
Opens the gray page where you can configure the Output Stage for Automated Data Distribution (ADD) v1 (see Use Automated Data Distribution).
This link works only for ADD v1 that enables you to upload data from the GoodData ADS (Data Warehouse; see Automated Data Distribution). This link does not work for ADD v2 for data warehouses (see Automated Data Distribution v2 for Data Warehouses) or ADD v2 for object storage services (see Automated Data Distribution v2 for Object Storage Services).
ADS
Opens the gray page where you can list all GoodData ADS (Data Warehouse) instances you have access to in the current domain (see Reviewing Your Data Warehouse Instances).
Data Sources
Opens the Data sources tab of the main page of the Data Integration Console (see Accessing Data Integration Console) where you can review your Data Sources and create a new one (see Create a Data Source).
Data sources~GP~
Opens the gray page where you can review your Data Sources and create a new one (see Create a Data Source).
Domain

The links in this tab are available only when you are the domain administrator for the current GoodData domain and this domain is associated with the current hostname in the Extension Tool.
If the domain is not associated with the hostname in the Extension Tool, the links are grayed out and dashed-underlined. To associate the domain with the hostname, click an underlined link, and specify the domain (the current domain is pre-populated). You can also associate the domain with the hostname in the configuration of the Extension Tool.
Users
Opens the gray page where you can review users existing in the domain.
Whitelabel
Opens the gray page where you can review white-labeling settings for the domain (see Customize the White-Labeled Domain).
Config
Opens the gray page where you can review and modify platform settings on a domain level (see Configure Various Features via Platform Settings).
LCM
Opens the gray page where you can review data products existing in the domain and create new data products (see Managing Workspaces via Life Cycle Management).
CORS
Opens the gray page where you can review and update the domains allowed for CORS access for your domain (see Retrieve domains allowed for CORS access).
Admins
Opens the gray page where you can review the accounts with domain admin privileges.
SSO
Opens the gray page where you can review the currently registered Authentication Providers (SSO) (see Single Sign-On Overview).
Custom

This is your personal tab where you can add up to 16 custom links. You can select from the standard links from the other tabs or add your own links using various placeholders.
Classic

This tab contains some of the standard links as they were presented in older versions of the Extension Tool.
If you prefer the old design, you can pin this tab to make its links visible all the time. Alternatively, you can customize links on the Custom tab in a similar way, and pin it.
Here is how the links of the Classic tab are mapped to the standard links:
| Classic Tab Link | Standard Link |
|---|---|
| New | Workspace -> New |
| List | Workspace -> List |
| Obj | Object -> Object |
| ObjEX | Object -> Explain |
| ObjUSE | Object -> Used |
| Proj | Workspace -> Info |
| MD | Metadata -> Metadata |
| Query | Metadata -> Query |
| LDM | Workspace -> Model |
| Mng | Object -> DDL |
| Valid | Object -> Validate |
| Exp | Workspace -> Export |
| ExpMD | Metadata -> MD Export |
| Imp | Workspace -> Import |
| ImpMD | Metadata -> MD Import |
| OS | Data load -> Output Stage |
| ETL | Data load -> Processes |
| Sch | Data load -> Schedules |
| SchGP | Data load -> SchedulesGP |
i icon
Opens a popup dialog with the basic information about the current workspace (see Overlay).
+ icon
Opens a page that allows you to modify the way how the Extension Tool behaves (see Configuration).
▷ icon
Starts an interactive tutorial which guides you through functionality and navigation of the Toolbar. This tutorial is also started automatically the first time you open the Toolbar.
? icon
Opens this help article.
Overlay
The Overlay is a popup dialog that provides basic information about the current workspace.
To open the Overlay, click the i icon. To refresh the information in the Overlay, click the i icon again.
Information Provided by Overlay
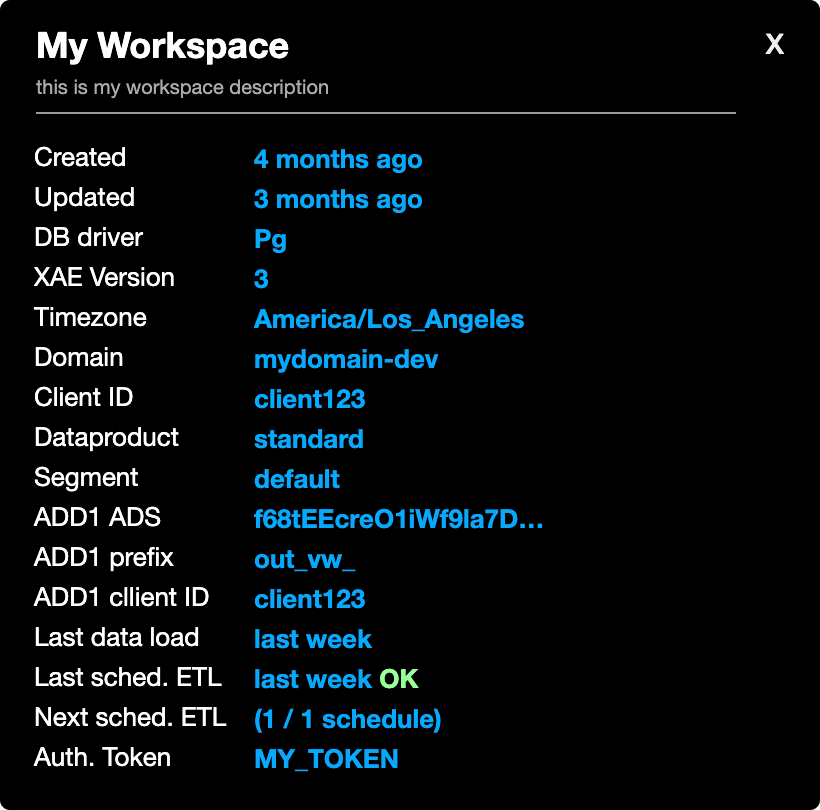
The Overlay provides the following information about the workspace:
Some values may be displayed only when you are an administrator in the current workspace.
- [workspace_name] is the name of the current workspace.
- [workspace_description] is the description of the workspace (if available).
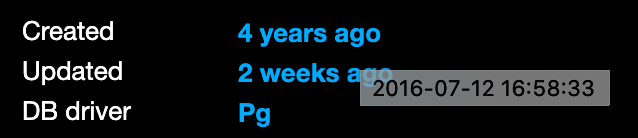
- Created is the approximate date when the workspace was created.
- Updated is the approximate date when the workspace was last updated.
- DB driver is the database engine the workspace runs on (can be
Verticafor Vertica orPgfor PostgreSQL). - XAE Version is the version of the Extensible Analytics Engine (XAE) the workspace runs on (see XAE - Extensible Analytics Engine). To find out what hierarchical level the version is defined from (whether it is set globally, for the domain or for the workspace), hover over the version number. To open the gray page where you can change the XAE version for the current workspace, click the version number (see Upgrading XAE to Version 3).
- Timezone is the time zone set in the workspace and used for date macros (see Referencing Floating Time Periods). To change the timezone, click the displayed timezone name (see Set a Custom Time Zone for Your Workspace).
- Domain is the name of the GoodData domain the workspace belongs to (see Your GoodData Domain).
- Client ID is the client ID associated with the workspace in Life Cycle Management (see Managing Workspaces via Life Cycle Management). To copy the Client ID to the clipboard, click it.
- Dataproduct is the data product ID associated with the workspace in Life Cycle Management (see Managing Workspaces via Life Cycle Management).
- Segment is the segment ID associated with the workspace in Life Cycle Management (see Managing Workspaces via Life Cycle Management).
- ADD1 ADS is the ID of the GoodData ADS (Data Warehouse) schema associated with the workspace for loading data with Automated Data Distribution (ADD) v1 (see Use Automated Data Distribution). To copy the whole JDBC connection string to the clipboard, click the schema ID.
- ADD1 prefix is the prefix of the tables associated with the workspace for loading data with ADD v1 (see Use Automated Data Distribution).
- ADD1 client ID is the client ID associated with the workspace for loading data with ADD v1 (see Use Automated Data Distribution). To copy the Client ID to the clipboard, click it.
- Last data load is the approximate date when data was last successfully loaded to any dataset in the current workspace.
- Last sched. ETL is the approximate date when the last scheduled data load process ran and the status of that execution (see Schedule a Process on the Data Integration Console). To open the execution log file for this run (if available), click the status name.
- Next sched. ETL is the approximate date when the next data load process is scheduled to run. If no process is scheduled to run, it shows the number of enabled schedules out of the total number of schedules.
- Auth. Token is the authorization token used to create the workspace. To copy the authorization token to the clipboard, click it.
By default, the Overlay displays approximate dates (for example, “last month” or “2 weeks ago”). To see the exact time and date behind an approximate date, hover over this approximate date.
Session Expiration
The Overlay uses APIs to gather the information in the background. To do that, the Overlay uses an existing GoodData session because the Extension Tool does not use or store any credentials.
With the GoodData authentication mechanism, it might happen that the temporary token (see GoodData Token Types) expires, which happens in 10 minutes after your last action on the page. In this case, the data might not be retrieved, and the “Unauthorized” message is displayed. If this happens, refresh the page (this will renew the temporary token), and open the Overlay again.
Metadata Tools
The Metadata Tools allow you to access and browse the metadata using the following methods:
Discovering Object Dependencies
Discovering object dependencies allows you to find out how metadata objects depend on each other. You can discover dependencies for the following types of metadata objects:
- Dashboard
- Insight
- Pixel-perfect dashboard
- Pixel-perfect report
- Attribute, fact, and metric
- Variable
A metadata object can have a tree-like hierarchy of dependencies. For example, the metric SELECT SUM(amount) WHERE Product = Computer uses the amount fact and the Product attribute. The metric itself can be used in another metric or in an insight, which in its turn can be used on a Dashboard.
When you are viewing a particular metadata object in the GoodData Portal or through the gray pages:
- Click Object -> Used to open a popup dialog that shows what other objects use this metadata object.
- Click Object -> Using to open a popup dialog that shows what other objects this metadata object uses.
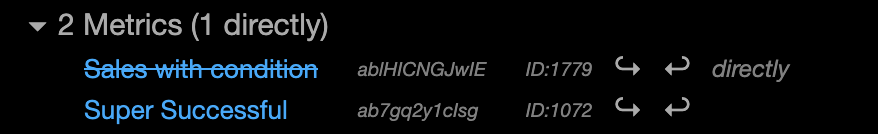
Report-specific metrics and objects which are marked as “deprecated” on the API are displayed with a strike-through to distinguish them. You may not be able to display these objects in the UI.
- To open the GoodData Portal page for a dependent object, click the object’s name.
- To copy a dependent object’s identifier to the clipboard, click the identifier.
- To copy a dependent object’s URI to the clipboard, click the object ID.
- To browse the dependencies further for a dependent object, click the arrows ↪ (where this object is used) and ↩ (what other objects this object uses).
You can also discover object dependencies using the APIs (see Get the objects used by an object and Get the objects using an object).
Translation of Object URIs
Translation of object URIs allows you to retrieve additional information about an object based on its URI.
When on the gray page with an object’s metadata where URIs to other objects (in the form of /gdc/md/{workspace_id}/obj/{object_id}) appear as links, hover over the URI of an object to display the type, title, and identifier of that object next to the URI.
When you select the object metadata JSON, this additional information will not be included in the selection to prevent JSON corruption. You can select it separately.
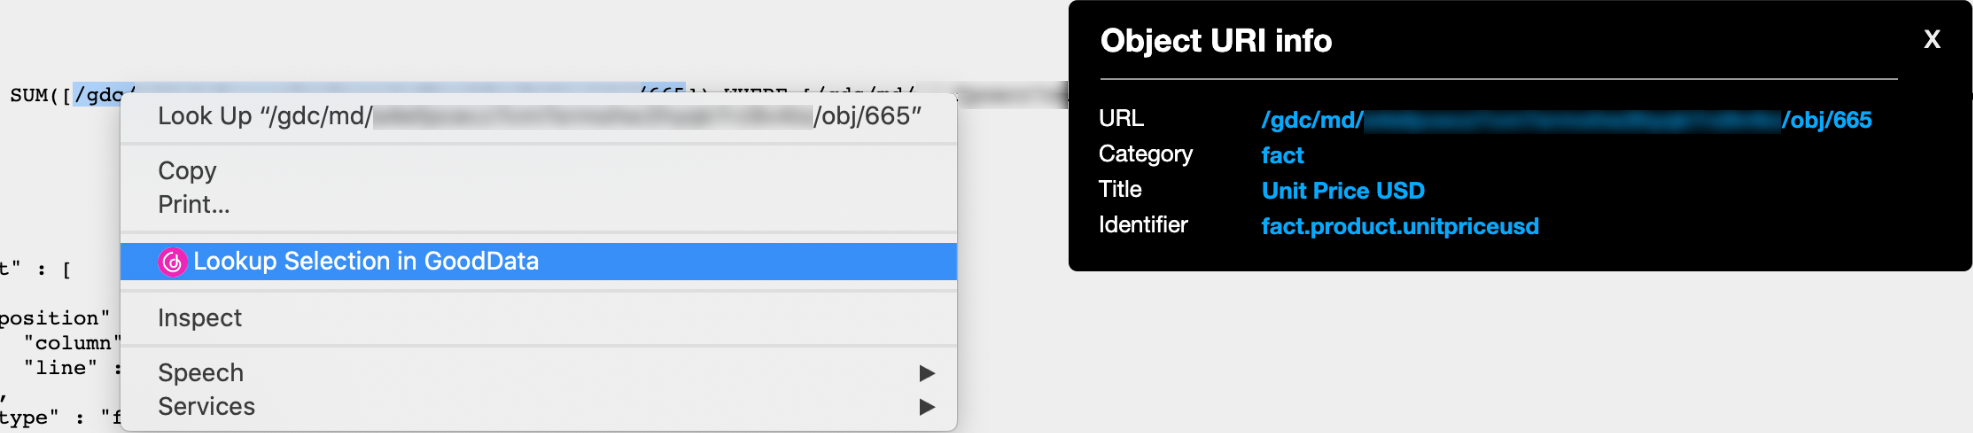
Right-click Integration
Right-click integration allows you to retrieve additional information about an object based on:
- The object URI that appears as plain text and cannot be translated as described in Translation of Object URIs (
/gdc/md/{workspace_id}/obj/{object_id}) Object URIs appear as plain text in, for example, metric expressions or data permission expressions (see Data Permissions). - The object identifiers (such as
aaZLL736hma6orfact.product.unitpriceusd) - Attribute value IDs (
/gdc/md/{workspace_id}/obj/{attribute_id}/elements?id={attribute_value_id})
By default, right-click integration is disabled. To enable it, see Enable Right-click Integration.
When on the gray page with an object’s metadata where other metadata objects are mentioned, select the whole URI or identifier of an object (or the attribute value ID for an attribute value), right-click, and select Lookup Selection in GoodData. If the selected text contains a valid object in the current workspace, an overlay with details about this object is displayed.
Session Expiration
The Metadata Tools use APIs to gather the information in the background. To do that, the Metadata Tools use an existing GoodData session because the Extension Tool does not use or store any credentials.
With the GoodData authentication mechanism, it might happen that the temporary token (see GoodData Token Types) expires, which happens in 10 minutes after your last action on the page. In this case, the data might not be retrieved, and the “Unauthorized” message is displayed. If this happens, refresh the page (this will renew the temporary token), and use the Metadata Tools again.
Log Parser
Log files of scheduled process executions contain a lot of useful information. However, particular details about an execution may be hard to locate in an extensive log file. The Log Parser extracts and displays information from the Data Integration Console log files in a user-friendly format.
The Log Parser is automatically executed whenever your browser opens a log file in the GoodData platform.
By default, the Log Parser is enabled. If you have issues accessing log files with the Log Parser enabled (for example, parsing a long log file takes a long time), you can disable it for some or all types of log files.
- To disable the Log Parser for a particular log file for the current session, append the log file URL with
#no_parse. - To disable the Log Parser permanently for some or all types of log files, see Disable the Log Parser.
The Log Parser works with log files for the following components:
- Automated Data Distribution (ADD) v1 (see Automated Data Distribution)
- Automated Data Distribution (ADD) v2 (see Automated Data Distribution v2 for Data Warehouses)
- SQL Executor
- ADS Integrator and CSV Downloader
- LCM Brics (see Bricks)
- CloudConnect graphs
Overlay Panel
When a log file is accessed, the Extension Tool automatically scrolls to the end of the log file and adds the following overlay panel to the top right corner:
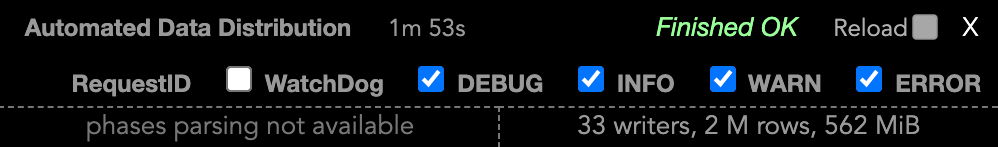
The overlay panel contains the following information:
- The name of the process
- How long the process has been running until now (based on the information from the log file)
- The execution status (still running, finished successfully, failed)
Use the following controls to adjust the log file processing:
To refresh the log file to see how the process has progressed, click Reload.
To have the log file automatically refreshed every five minutes, select the checkbox next to Reload. The log file will be refreshed until the Extension Tool detects that the process has finished successfully or failed.
You can configure the Extension Tool to display a desktop notification when a process finishes and the window with the log file is not in focus. You can also configure the Extension Tool to play a sound notification when a process finishes successfully or fails.To show or hide individual log levels (
DEBUG,INFO,WARN,ERROR), select and deselect the corresponding checkboxes.WatchDogis relevant only for CloudConnect graphs and corresponds to the WatchDog process in CloudConnect.To reload the log file in its original format, without being parsed by the Extension Tool and including the information that the Extension Tool may have hidden as irrelevant (such as the internal process ID), click X.
Depending on the category of the accessed log file, the overlay panel may display additional information in two bottom sections.
Click a section to display detailed information. To expand the section, hover inside it.
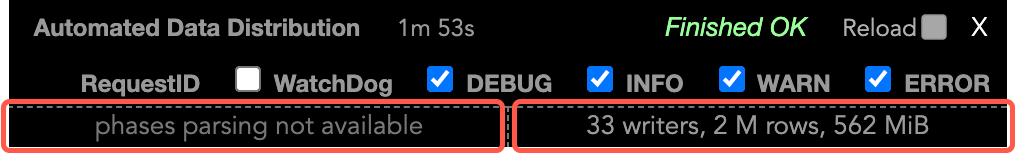
ADD v1
For ADD v1 processes (see Automated Data Distribution), the Log Parser provides additional information in the right bottom section.
When the section is collapsed, the following information is displayed:
- The number of loaded datasets
- The number of loaded records
- Rough volume of loaded data
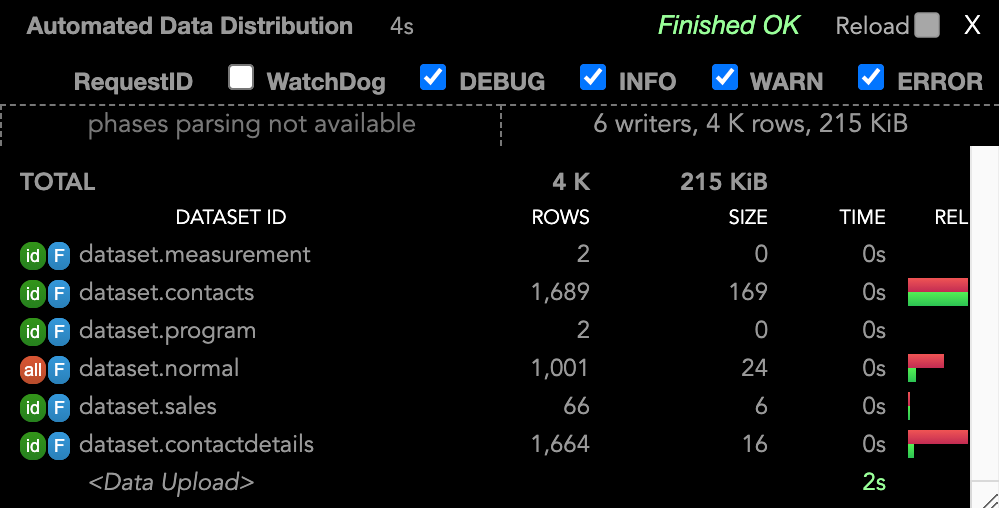
When the section is expanded, the datasets are listed with the following information about each of them:
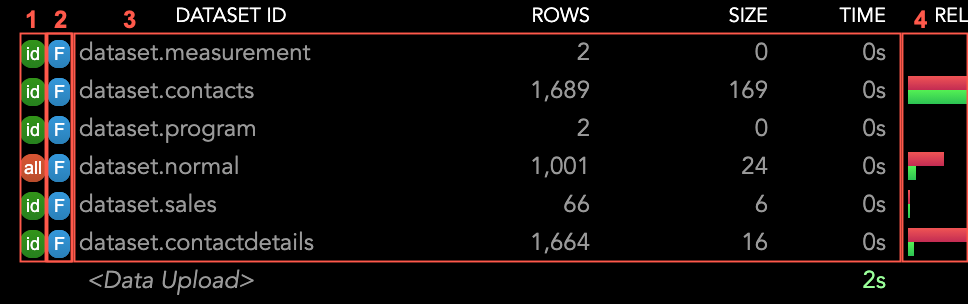
- 1: The icon indicates whether the
x__client_idparameter was used when loading data to the dataset (see Use Automated Data Distribution).- id means that the
x__client_idparameter was used and the data was loaded to the dataset based on the client ID. - all means that the
x__client_idparameter was not used and all the source data was loaded to the dataset.
- id means that the
- 2: The icon indicates what load mode was used when loading data to the dataset (see Automated Data Distribution and Delete Data from Datasets in Automated Data Distribution).
- F means full mode.
- I means incremental mode.
- D means delete mode load.
- N means no data was loaded.
- 3: The section provides basic information about the dataset:
- The dataset identifier
- The number of rows extracted to be loaded to the dataset
- Volume of data loaded to the dataset
- Duration of the data extraction
- 4: The bars represent a relative size of the dataset compared to the size of the largest dataset.
- The red bar represents the relative size in terms of the number of rows.
- The green bar represents the relative size in terms of data volume.
The last row shows the total time spent on loading all the extracted data to the workspace.
ADDv2
For ADD v2 processes (see Automated Data Distribution v2 for Data Warehouses), the Log Parser provides additional information in the right bottom section.
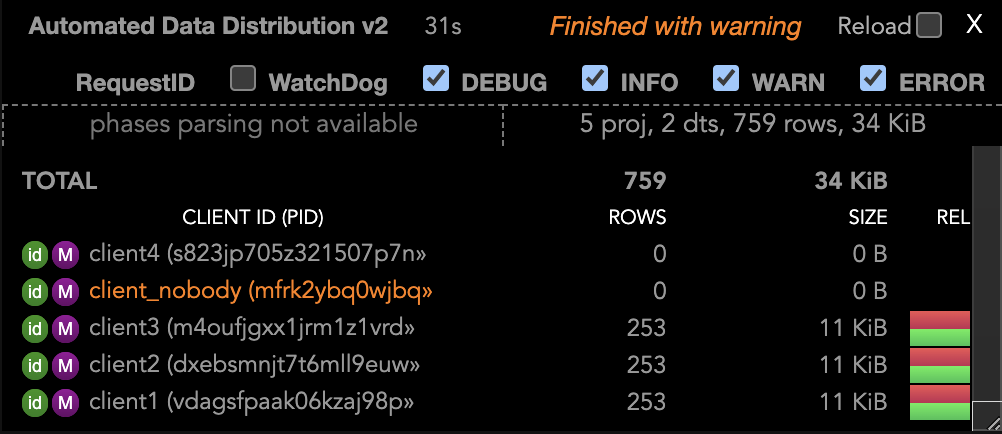
When the section is collapsed, the following information is displayed:
- The number of workspaces to which data are being loaded
- The number of loaded datasets
- The number of loaded records
- Rough volume of loaded data
When the section is expanded, the workspaces are listed with detailed information about each of them. If there are more workspaces loaded in the segment mode, you can click each workspace to display the details about this workspace’s dataset details:
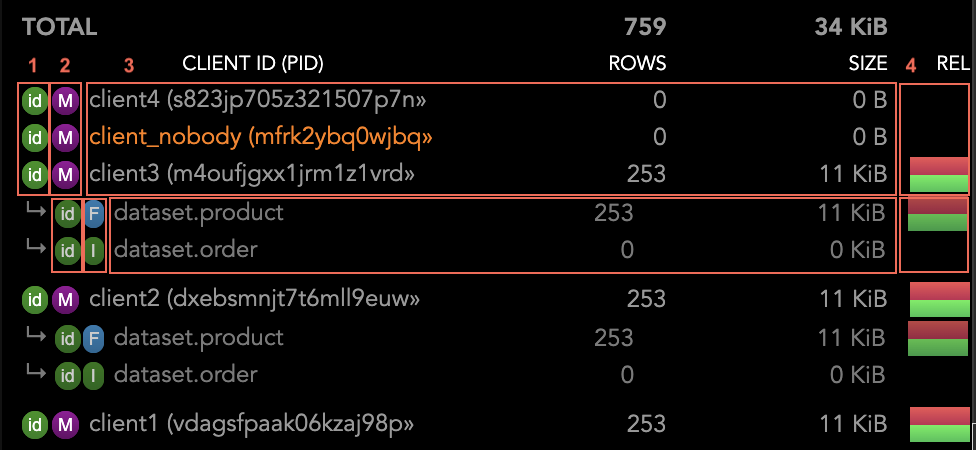
- 1: The icon indicates whether the
x__client_idparameter was used when loading data to the dataset (see Use Automated Data Distribution).- id means that the x__client_id parameter was used and the data was loaded to the dataset based on the client ID.
- all means that the x__client_id parameter was not used and all the source data was loaded to the dataset.
- M means that some datasets of this workspace were using the x__client_id parameter and some were not.
- ? means that it was not possible to detect whether the x__client_id parameter was used or not. This is typical for loading from flat files.
- 2: The icon indicates what load mode was used when loading data to the dataset (see Automated Data Distribution and Delete Data from Datasets in Automated Data Distribution).
- F means full mode.
- I means incremental mode.
- M means mixed mode where some datasets of this workspace were loaded with the full and some with the incremental mode.
- D means delete mode load.
- N means no data was loaded.
- 3: The section provides basic information about the workspace (or dataset in expanded mode):
- The Client ID if it is used, workspace ID (or dataset identifier in expanded mode).
- The number of rows extracted to be loaded to the workspace/dataset.
- Volume of data loaded to the workspace/dataset.
- 4: The bars represent the relative size of the dataset compared to the size of the largest workspace (or dataset of the current workspace in expanded mode).
- The red bar represents the relative size in terms of the number of rows.
- The green bar represents the relative size in terms of data volume.
If there was an issue loading a particular workspace, line of this workspace will be displayed in orange in the list.
SQL Executor
For SQL Executor processes, the Log Parser provides additional information in the left bottom section.
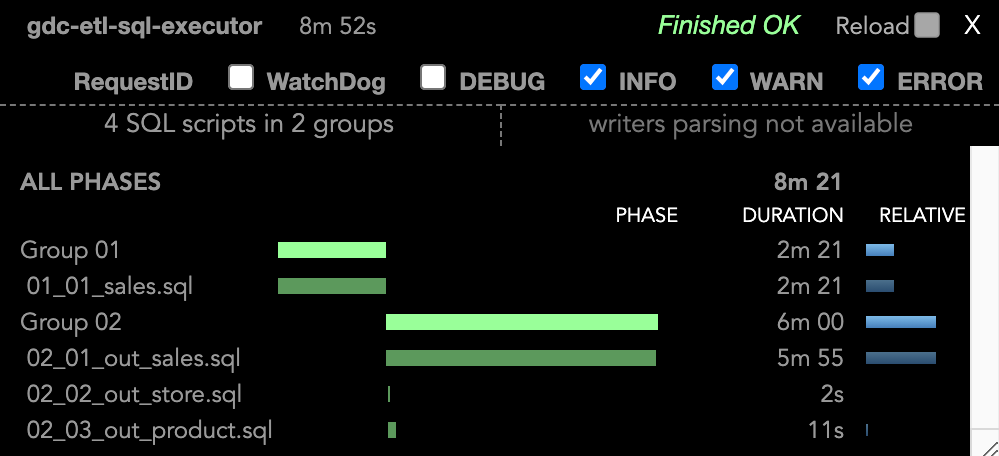
When the section is collapsed, the following information is displayed:
- The number of executed SQL scripts
- The number of groups the SQL scripts were executed in
When the section is expanded, the SQL scripts are listed with the following information about each of them:
- The group in which the script was executed
- The name of the script (click the name to scroll the log to the beginning of this script)
- The relative time that the execution took to complete displayed on the timeline
- The actual time that the execution took to complete
- The relative time that the execution took to complete comparing to the other scripts
ADS Integrator and CSV Downloader
ADS Integrator and CSV Downloader support many configuration options. The Log Parser works with only a subset of those options.
For the most common configurations, the Log Parser displays:
- For ADS Integrator processes - the list of processed entities and duration of the processing
- For CSV Downloader processes - the names of processed manifests
CloudConnect Graphs
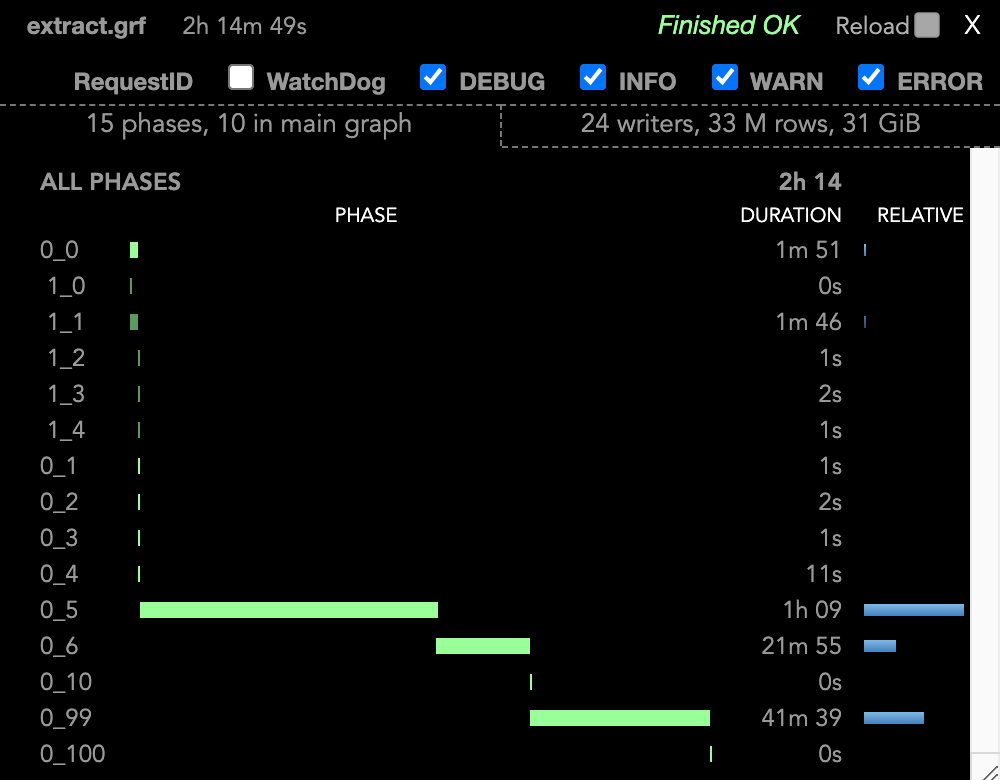
For CloudConnect graph processes, the Log Parser provides additional information in the both bottom sections.
- The left bottom section shows the duration of CloudConnect phases.
- The right bottom section shows volume of the data loaded to the datasets and duration of the data loading.
Configuration
The Configuration allows you to modify the way how the Extension Tool behaves.
Configure the Extension Tool
Steps:
- Open the page with the configuration options. Although the configuration page is styled like a GoodData gray page, any changes that you make there affect only the Extension Tool and do not affect your workspaces.
- Click the + icon from the Toolbar.
or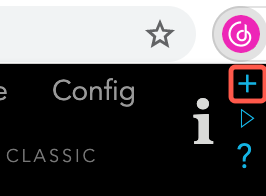
- Right-click the Extension Tool icon in your browser, and select Options.
- Click the + icon from the Toolbar.
- Review the configuration options and adjust them as needed. The changes are saved automatically as you make them. For detailed information about what you can configure, see Configuration Options.
- If you have any GoodData page open (the GoodData Portal or a gray page), refresh the page.
Configuration Options
Enable the Extension Tool for Hostnames
You can manually add or remove hostnames for which the Extension Tool is enabled.
- To add a hostname, locate the Modify hostnames where the extension is enabled section, enter the hostname, and click Add new. If the browser asks you to grant the permission, approve the request.
- To remove a hostname, locate the Modify hostnames where the extension is enabled section, select the hostname that you want to remove, and click Remove selected.
Associate Domains and Service Workspaces with Hostnames
You can associate a GoodData domain and/or a service workspace with each hostname for which the Extension Tool is enabled. The associated domain will be used in the links in the Domain tab. The service workspace will be used in the Service link.
- Hostnames with a domain associated are marked with an orange circle icon.
- Hostnames with a service workspace associated are marked with a blue triangle icon.
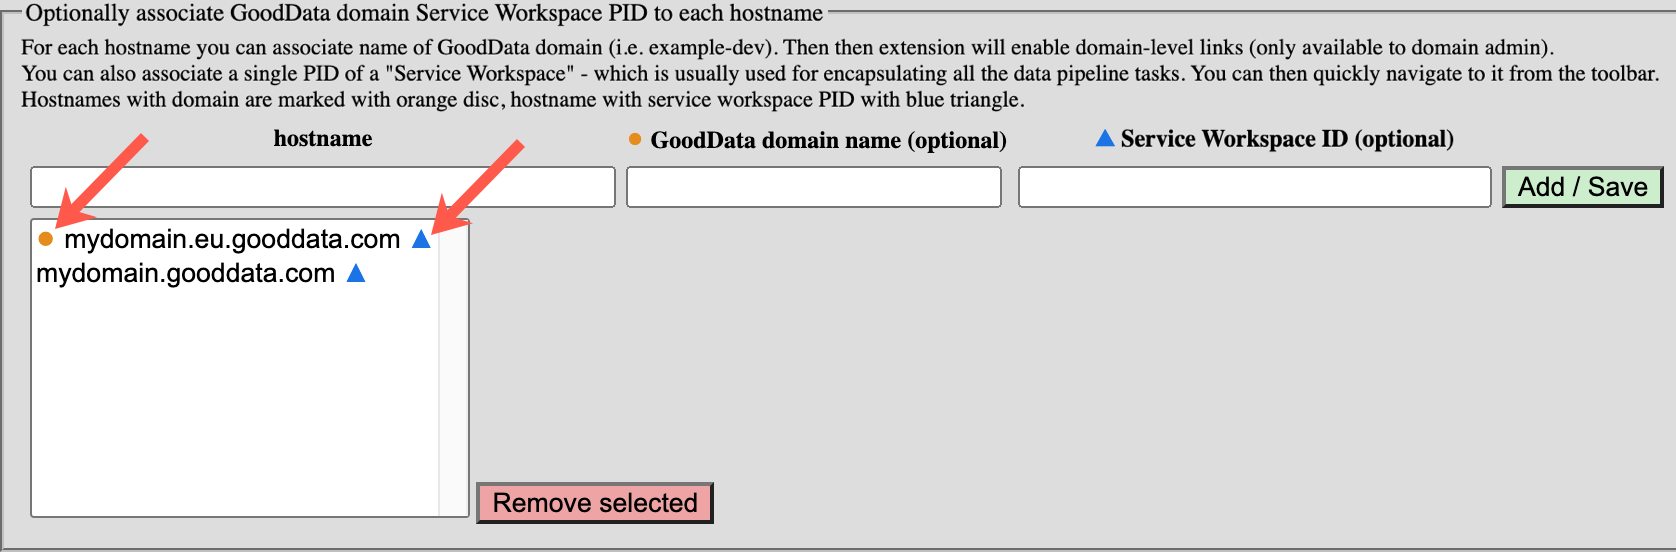
To update the associated domain and/or service workspace, select the hostname in the list, and update the domain and the service workspace ID as needed.
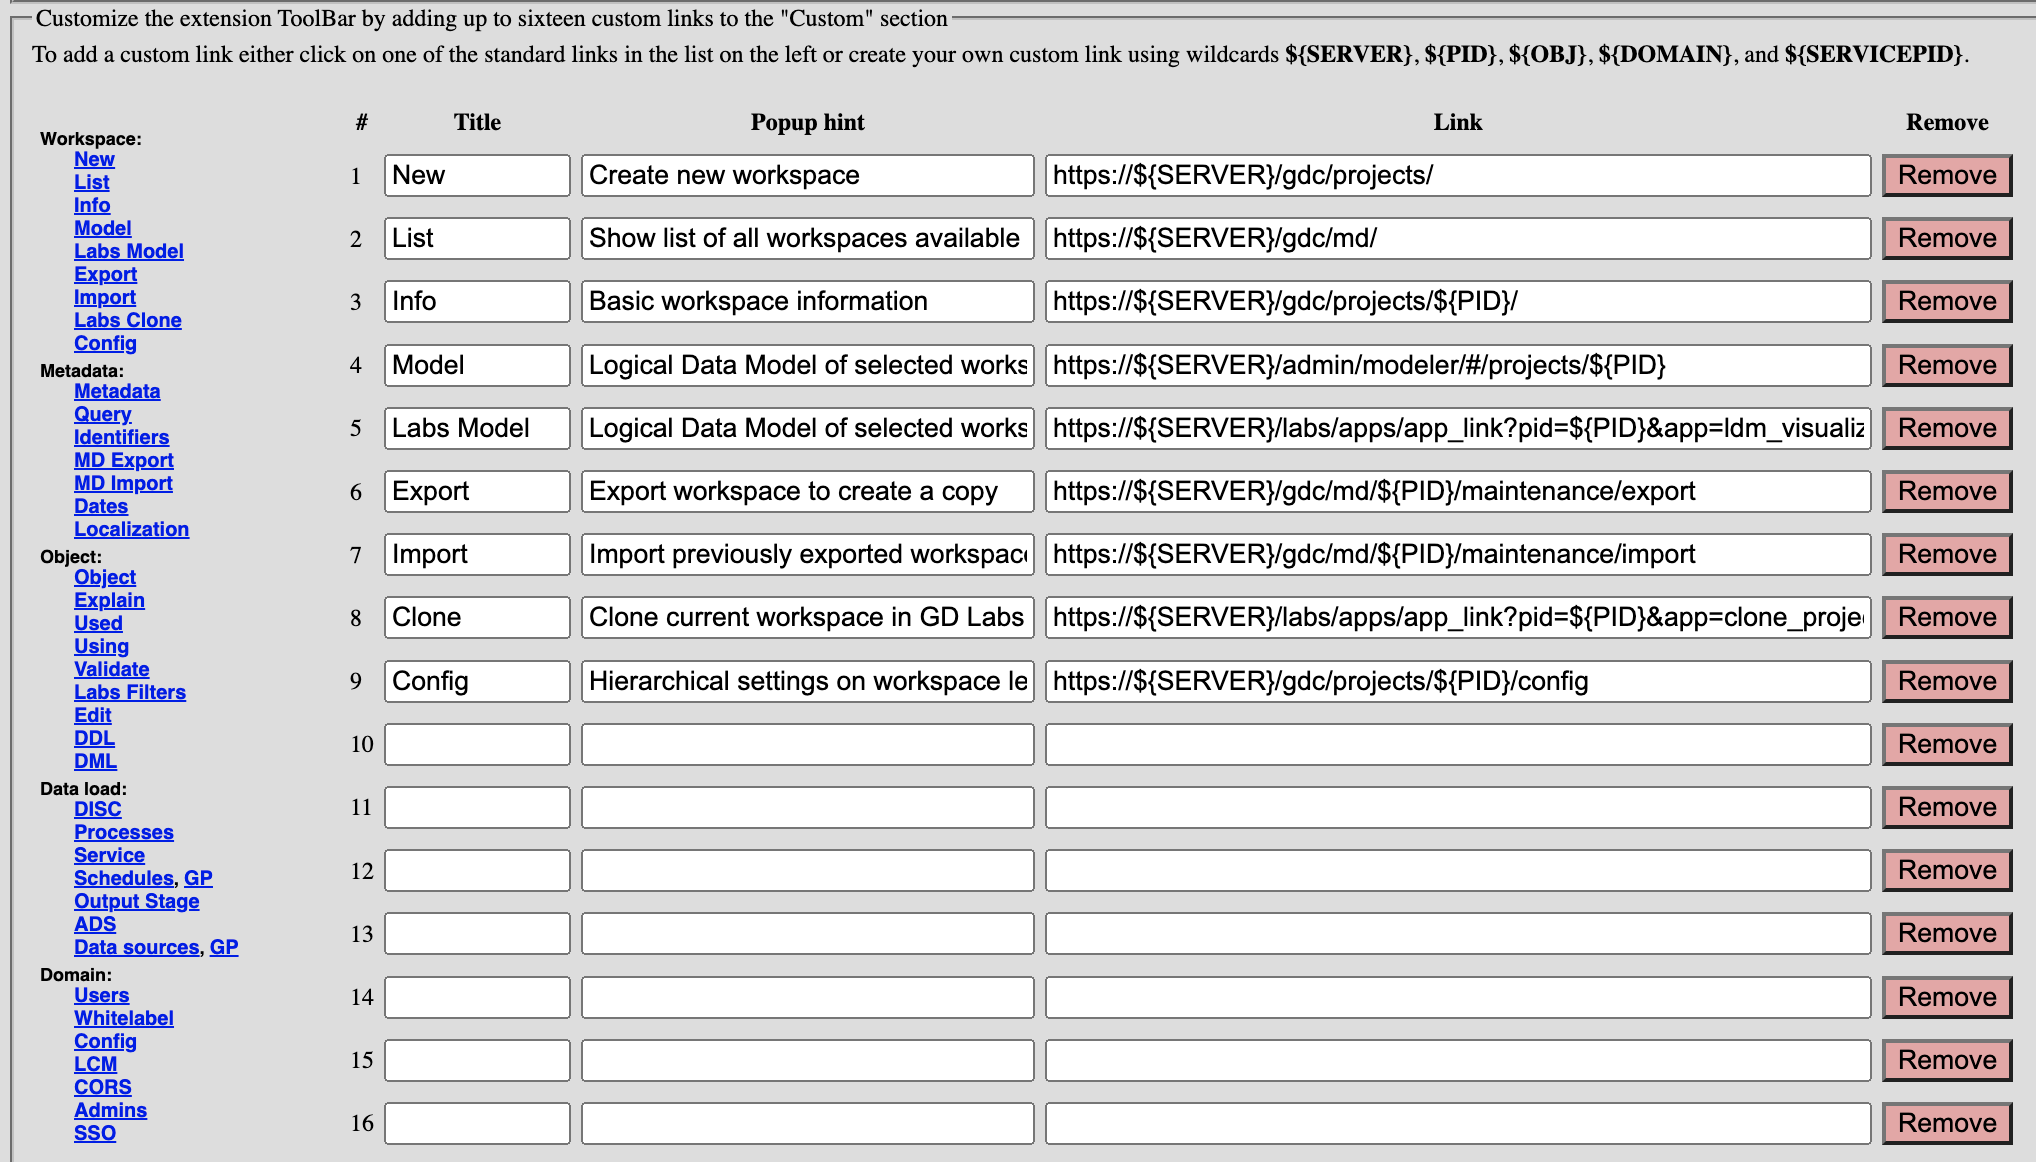
Customize the Custom Tab
You can add up to 16 custom links to the Custom tab of the Toolbar.

You can add any link from the standard links in the Toolbar or add your own custom link.
- To use a standard link, click its name. The link will populate the first empty slot. If no slot is empty, the link will populate slot #16 rewriting whatever link is already there.
- To add a custom link, fill in the fields in an empty slot:
- Title specifies the name of the link that appears on the Custom tab. Keep the name short to save the space.
- Popup hint specifies the tooltip that appears when you hover over the link title.
- Link specifies the target URL where the link leads. You can use the following placeholders that the Extension Tool will automatically replace with actual values:
${SERVER}represents the current hostname.${PID}represents the ID of the current workspace.${OBJ}represents the ID of the current metadata object.${DOMAIN}represents the current GoodData domain.${SERVICEPID}represents the ID of the service workspace associated with the current hostname (see Associate Domains and Service Workspaces with Hostnames).${OBJURL}mimics the Object link.${USEDBY}mimics the Used link.${USING}mimics the Using link.
Enable Right-click Integration
Right-click integration is one of the methods of discovering an object’s metadata used in the Metadata Tools.
By default, right-click integration is disabled. To enable it, locate the Grant or revoke extension permissions section, and click Grant next to Context Menus.
Enable Desktop Notifications for Execution Progress
When using the Log Parser to browse log files, you can configure the Extension Tool to display a desktop notification when a process finishes and the window with the log file is not in focus.
To enable desktop notifications, locate the Grant or revoke extension permissions section, and click Grant next to Desktop Notifications. If the browser asks you to grant the permission, approve the request.
Disable the Log Parser
By default, the Log Parser is enabled. If you have issues accessing log files with the Log Parser enabled (for example, parsing an extensive log file takes a long time), you can disable it for some or all types of log files.
To disable the Log Parser, locate the Disable ETL Log Parser section, and select the checkboxes for those types of log files that you want to disable the Log Parser for.
Some other browser extensions, such as password-managers, ad-blockers etc., may also affect the performance of displaying the parsed logs. If you have issues with displaying parsed logs, try to disable or pause these other extensions for your site.
Change the Extension Icon
You can change the default Extension Tool icon that appears in your browser toolbar. You can select one of the predefined icons.
To change the icon, locate the Global extension icon section and choose an icon from the dropdown.
Set Up an Icon for a Specific Hostname
If you have more than one hostname you regularly work with, you can set up a different icon for up to five hostnames. This way, you can quickly distinguish which hostname you are in based on the Extension Tool icon. All other hostnames will use the default icon.
To set up an icon for a hostname, locate the Show different extension icon according to hostname section, enter the hostname (you can specify either the exact hostname or a regular expression), and choose an icon from the dropdown.
Set Up an Icon for a Specific Workspace
If you have more than one workspace you regularly work with, you can set up a different icon for up to five workspaces. This way, you can quickly distinguish which workspace you are in based on the Extension Tool icon. All other workspaces will use the default icon.
To set up an icon for a workspace, locate the Show different extension icon for specific Workspace/Project section, enter the ID of the workspace, and choose an icon from the dropdown.
Export and Import the List of Hostnames
You can copy a JSON representation of the hostnames for which the Extension Tool is enabled, and re-use it on a different machine, in a different browser instance, or for a different GoodData user.
- To export the list, locate the Export or Import the extension configuration section, and copy the content of the export/import hostnames field.
- To import the list, replace the content of the export/import hostnames field with the copied content, and click Import Hostnames.
Export and Import the Configuration of the Extension Tool
You can copy a JSON representation of the whole configuration of the Extension Tool, and re-use it on a different machine, in a different browser instance, or for a different GoodData user.
- To export the configuration, locate the Export or Import the extension configuration section, and copy the content of the export/import settings field.
- To import the configuration, replace the content of the export/import settings field with the copied content, and click Import options.
Disable the Quick Edit Feature on Dashboards
The Extension Tool automatically enables the quick edit feature on Dashboards. This feature shows an edit icon (in the form of a pencil) when you hover over an insight on a Dashboard in view mode. Clicking this icon opens the insight in Analytical Designer where you can edit it and save as a new insight (see Edit Items on Dashboards).
The quick edit feature is client-side and is added by the Extension Tool. Users who do not have the Extension Tool installed will not see it in their Dashboards.
If the quick edit feature is unwanted, you can disable it. To do so, locate the Disable KPI Dashboards improvements section, and select the Do NOT add functions to KPI dashboards checkbox.