Embedding Dashboards
In this article, you will learn how to quickly embed a dashboard, GoodData’s presentation layer, in your own product and provide it to your own customers to see and work with dashboards.
In this basic guide, you will create an embedding URL, test it locally, and finally you will test the functionality of the embedded KPI dashboard.
Prerequisites
For the purpose of this exercise, you will work with the GoodData Demo Workspace and the Product Details dashboard.
The minimum dimension of 1170×575 pixels is required for KPI Dashboards to be embedded correctly.
You will need the following items, all of which can be found in the URL:
- workspace ID Identifies the workspace that you want to embed, Demo Workspace in this case
- dashboard ID Identifies the dashboard that you want to embed, Revenue by Quarter in this case
- domain Identifies your domain - anything that precedes gooddata.com (
secure.gooddata.com,company.on.gooddata.com,freeEXAMPLE.na.gooddata.com)
Create a URL for Embedding Dashboards
Steps:
Log in to the GoodData Portal.
Click the Dashboards tab.
Select the Demo Workspace as a workspace to work with.

Click the Overview dashboard.
Check the URL in the browser bar.: Format:
https://domain.gooddata.com/dashboards/#/workspace/{workspace_id}/dashboardId/{dashboardID}Example:
https://acme.on.gooddata.com/dashboards/#/workspace/sPDY7MMLCR4marKCQMqXKZFr56JGUL/dashboardID/751Add the string
/embedded/into the URL after/dashboards. Format:https://domain.gooddata.com/dashboards/embedded/#/workspace/{workspace_id}/dashboardId/{dashboardID}Example:
https://acme.on.gooddata.com/dashboards/embedded/#/workspace/sPDY7MMLCR4marKCQMqXKZFr56JGUL/dashboardID/751You can now use this completed URL as the basis for embedding a KPI Dashboard.
You can add additional tags to the HTML string to configure which elements of the KPI Dashboards interface you want to display or hide (navigation panel, editing options, filter bar). To learn how to do that, see Embed a Dashboard in our main documentation set.
Embed a Dashboard Locally
You can now test the embedding URL locally in your browser using a simple iframe.
Steps:
Save the following code sample as an *.html file.
<html>
<head>
    <meta http-equiv="Content-Type" content="text/html; charset=utf-8">
    <title>My App</title>
</head>
<body>
    <h1>Getting Started with Embedding KPIs</h1>
<p>
<iframe name="embeddedGoodDataIframe" id="gooddata" frameborder="0" title="embedded" width=1200px height=700px src="https://domain.gooddata.com/dashboards/embedded/#/workspace/{workspace_id}/dashboardId/{dashboardId}">
</iframe>
</p>
<p>Powered by Coffee</p>
</body>
Replace the sample URL with the URL of your dashboard.
Open the html file in your browser. If prompted, enter you credential. Your embedded Overview dashboard is displayed. Scroll down to display the rest of the dashboard in the frame.
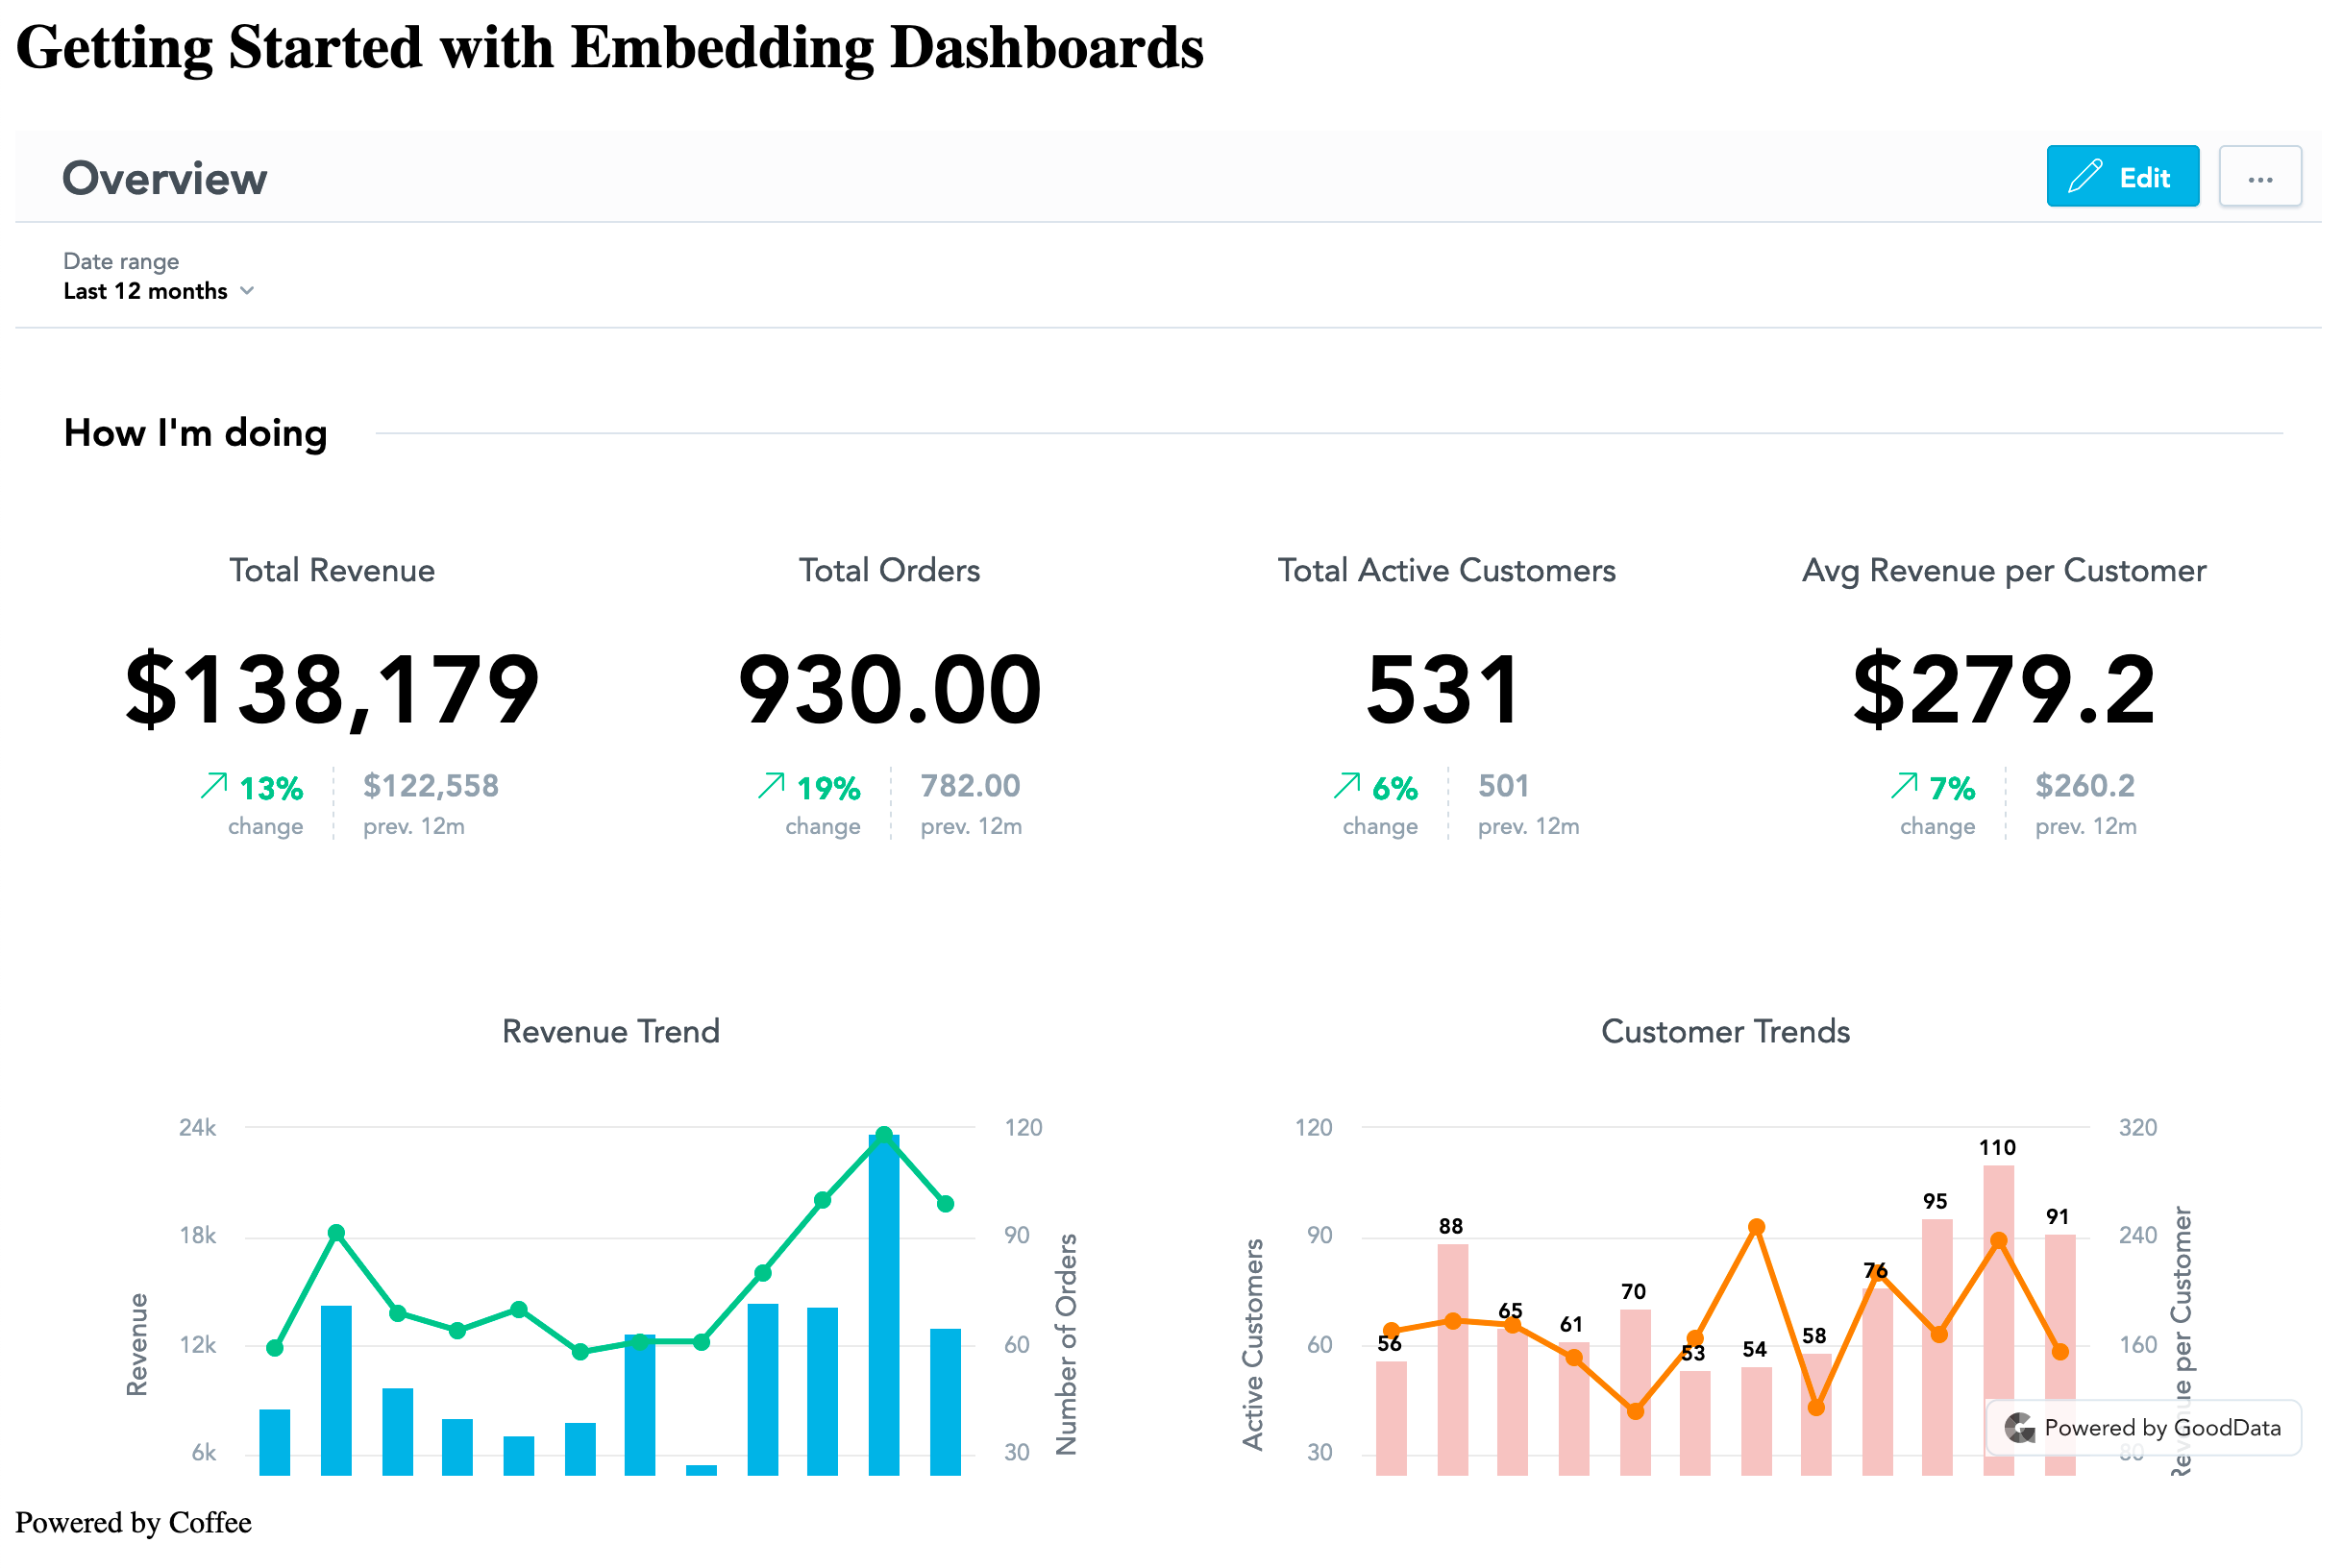
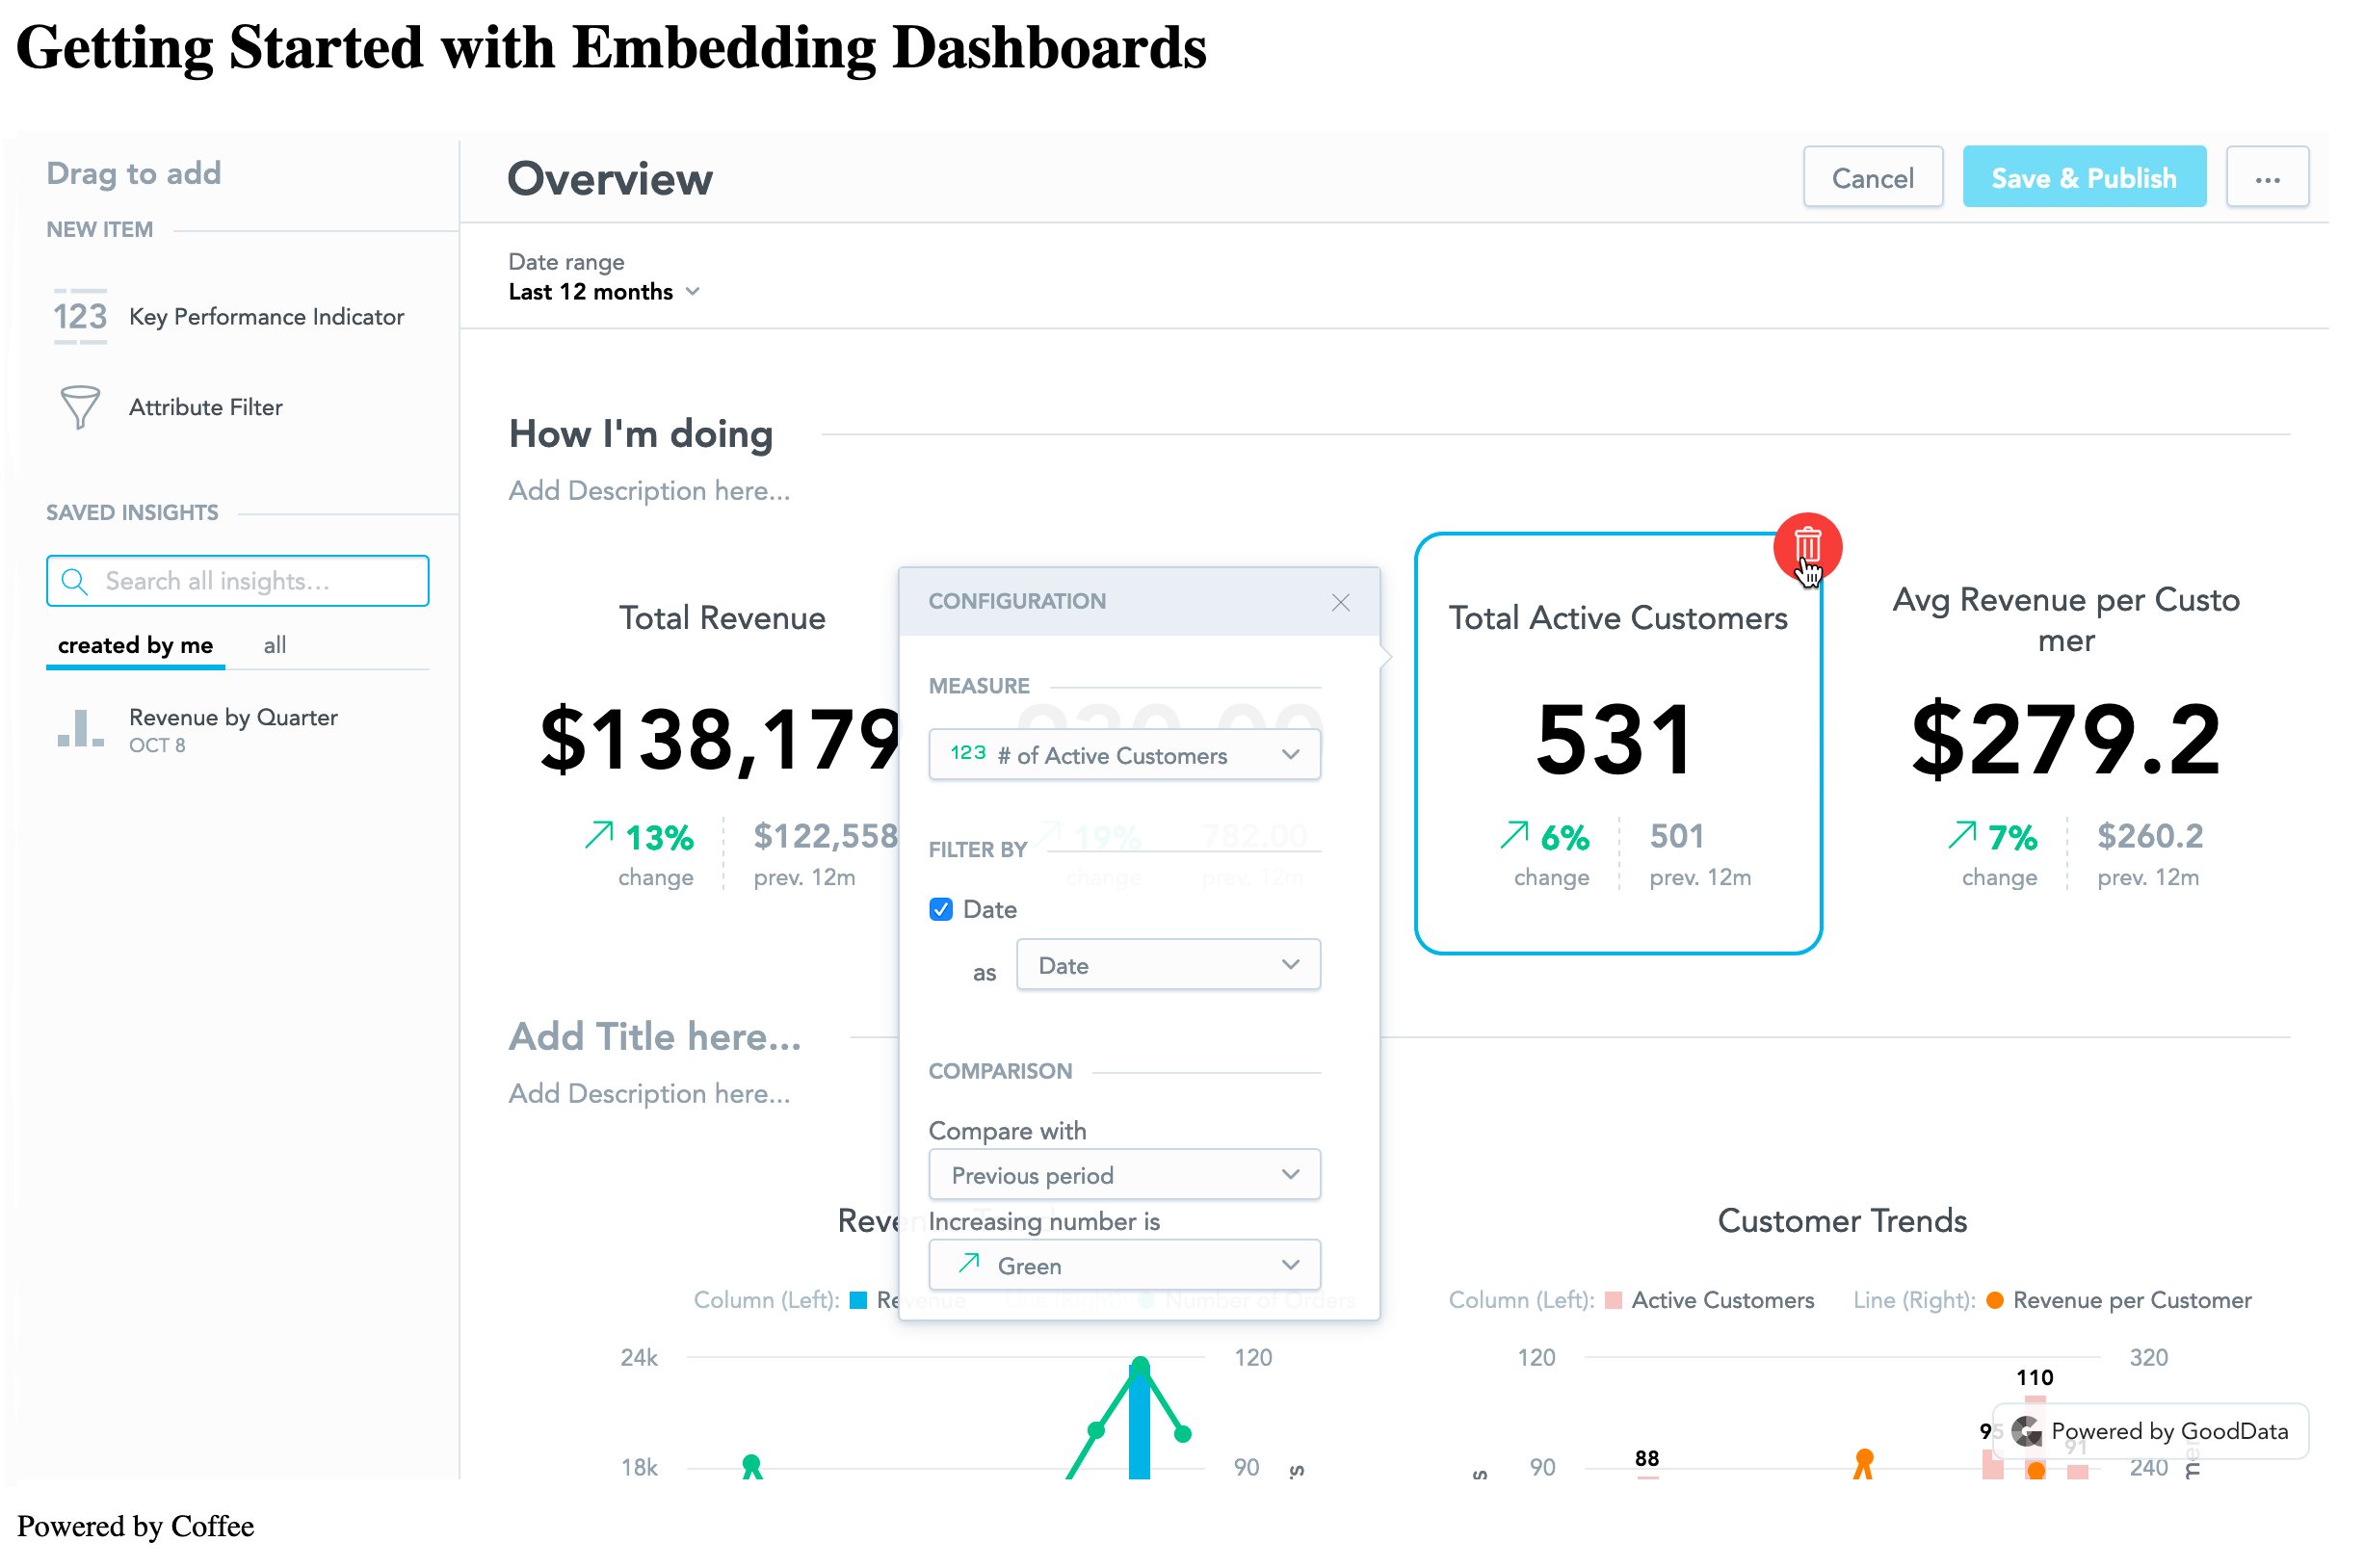
Test and Edit the Embedded Dashboard
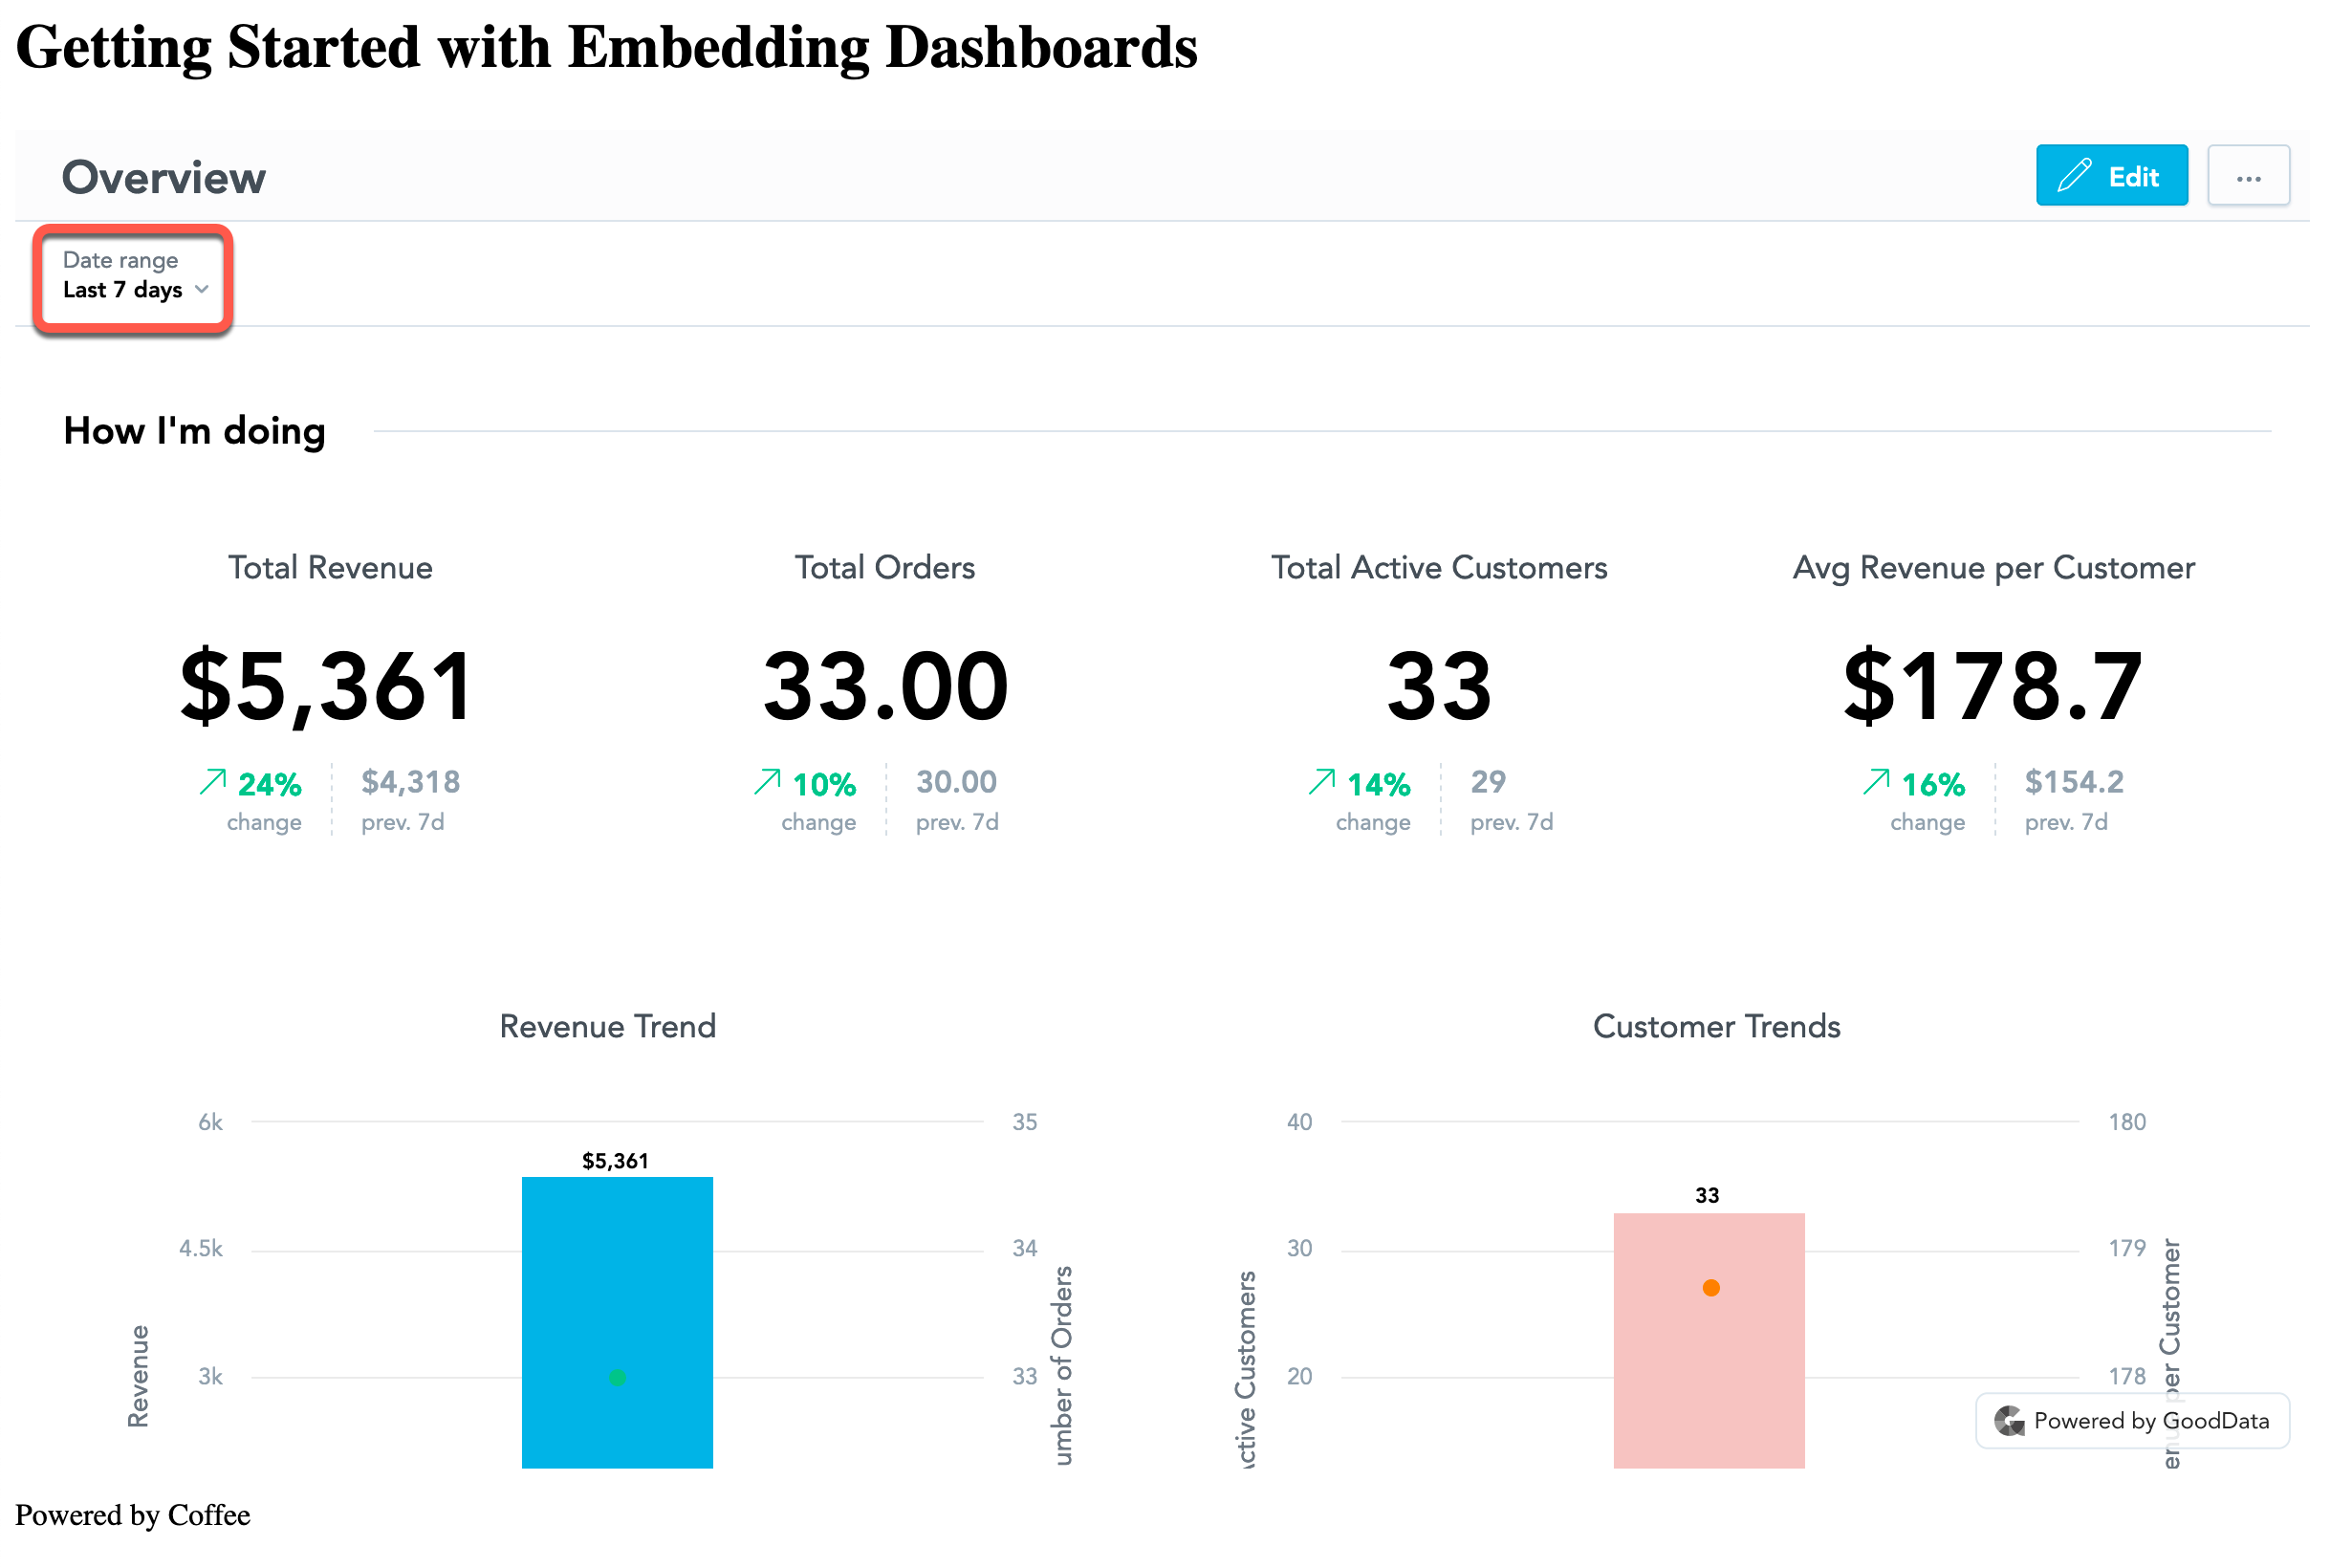
You can quickly test the functionality of the KPI dashboard by, for example, changing the date range.
Simply click the change the value in the Date range field from Last 12 months to Last 7 days.
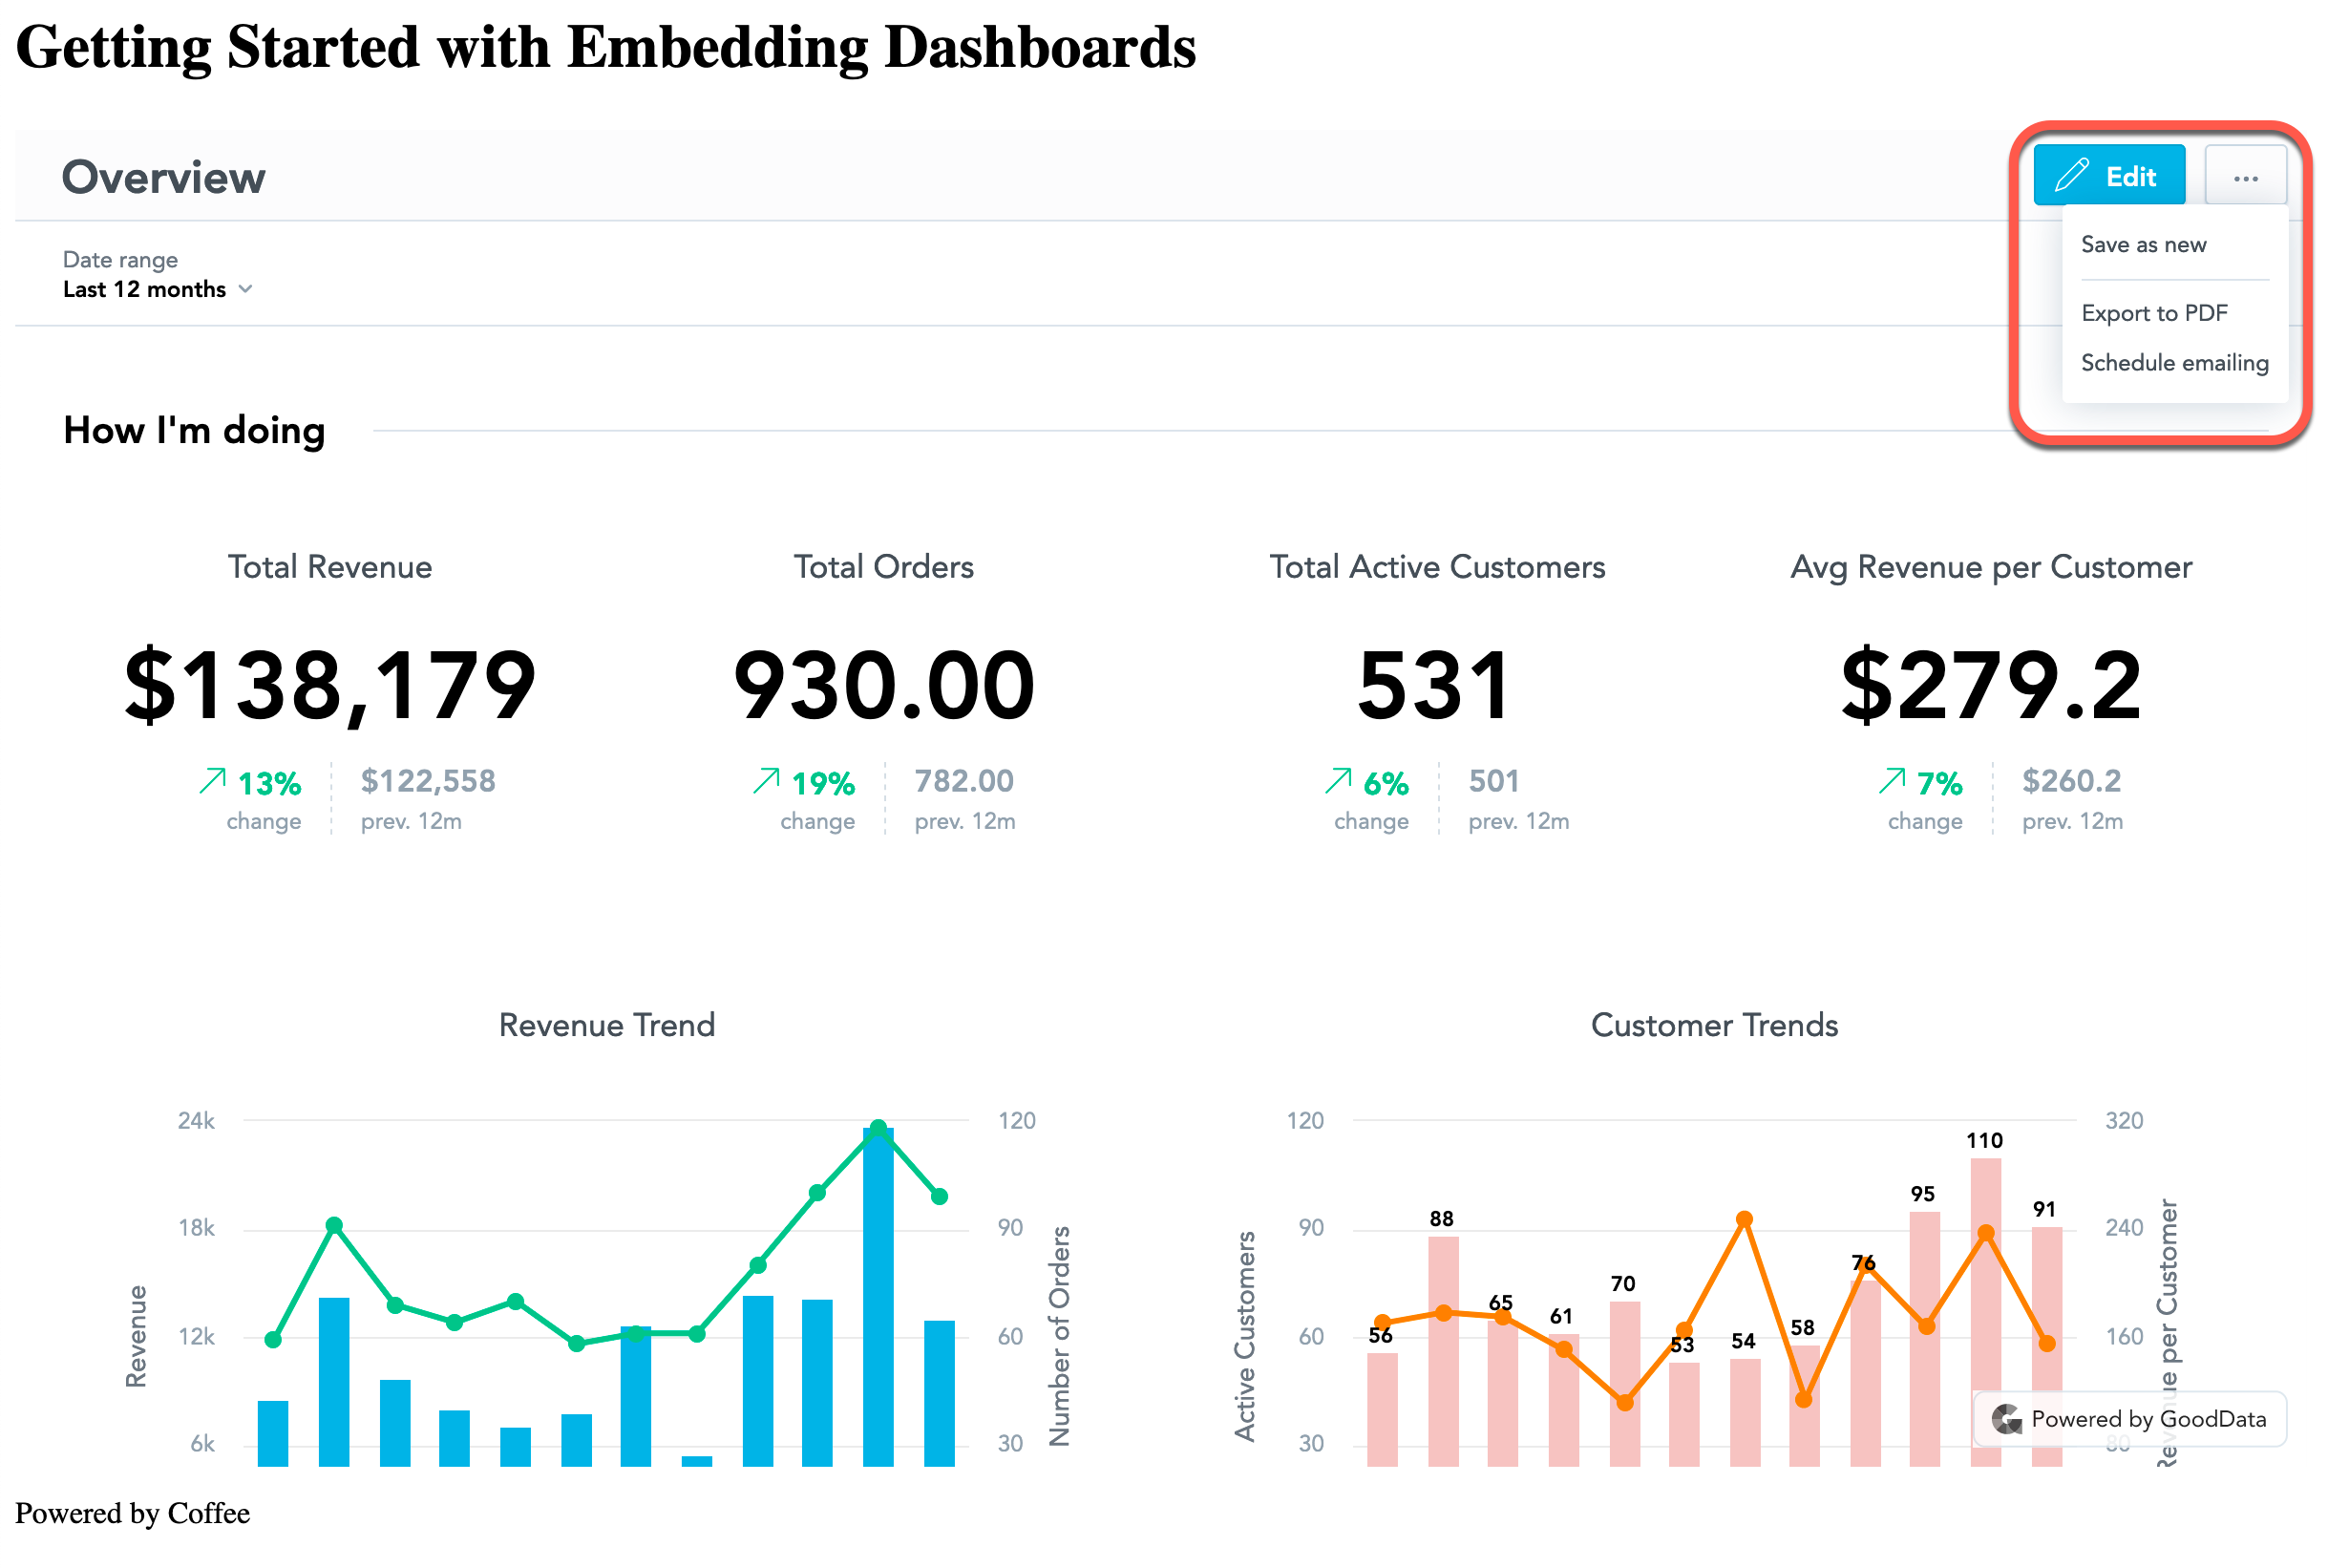
You can also save the dashboard as a new one, export it as an PDF and schedule emailing.
In this dashboard embedding scenario, you retain a full editing control.
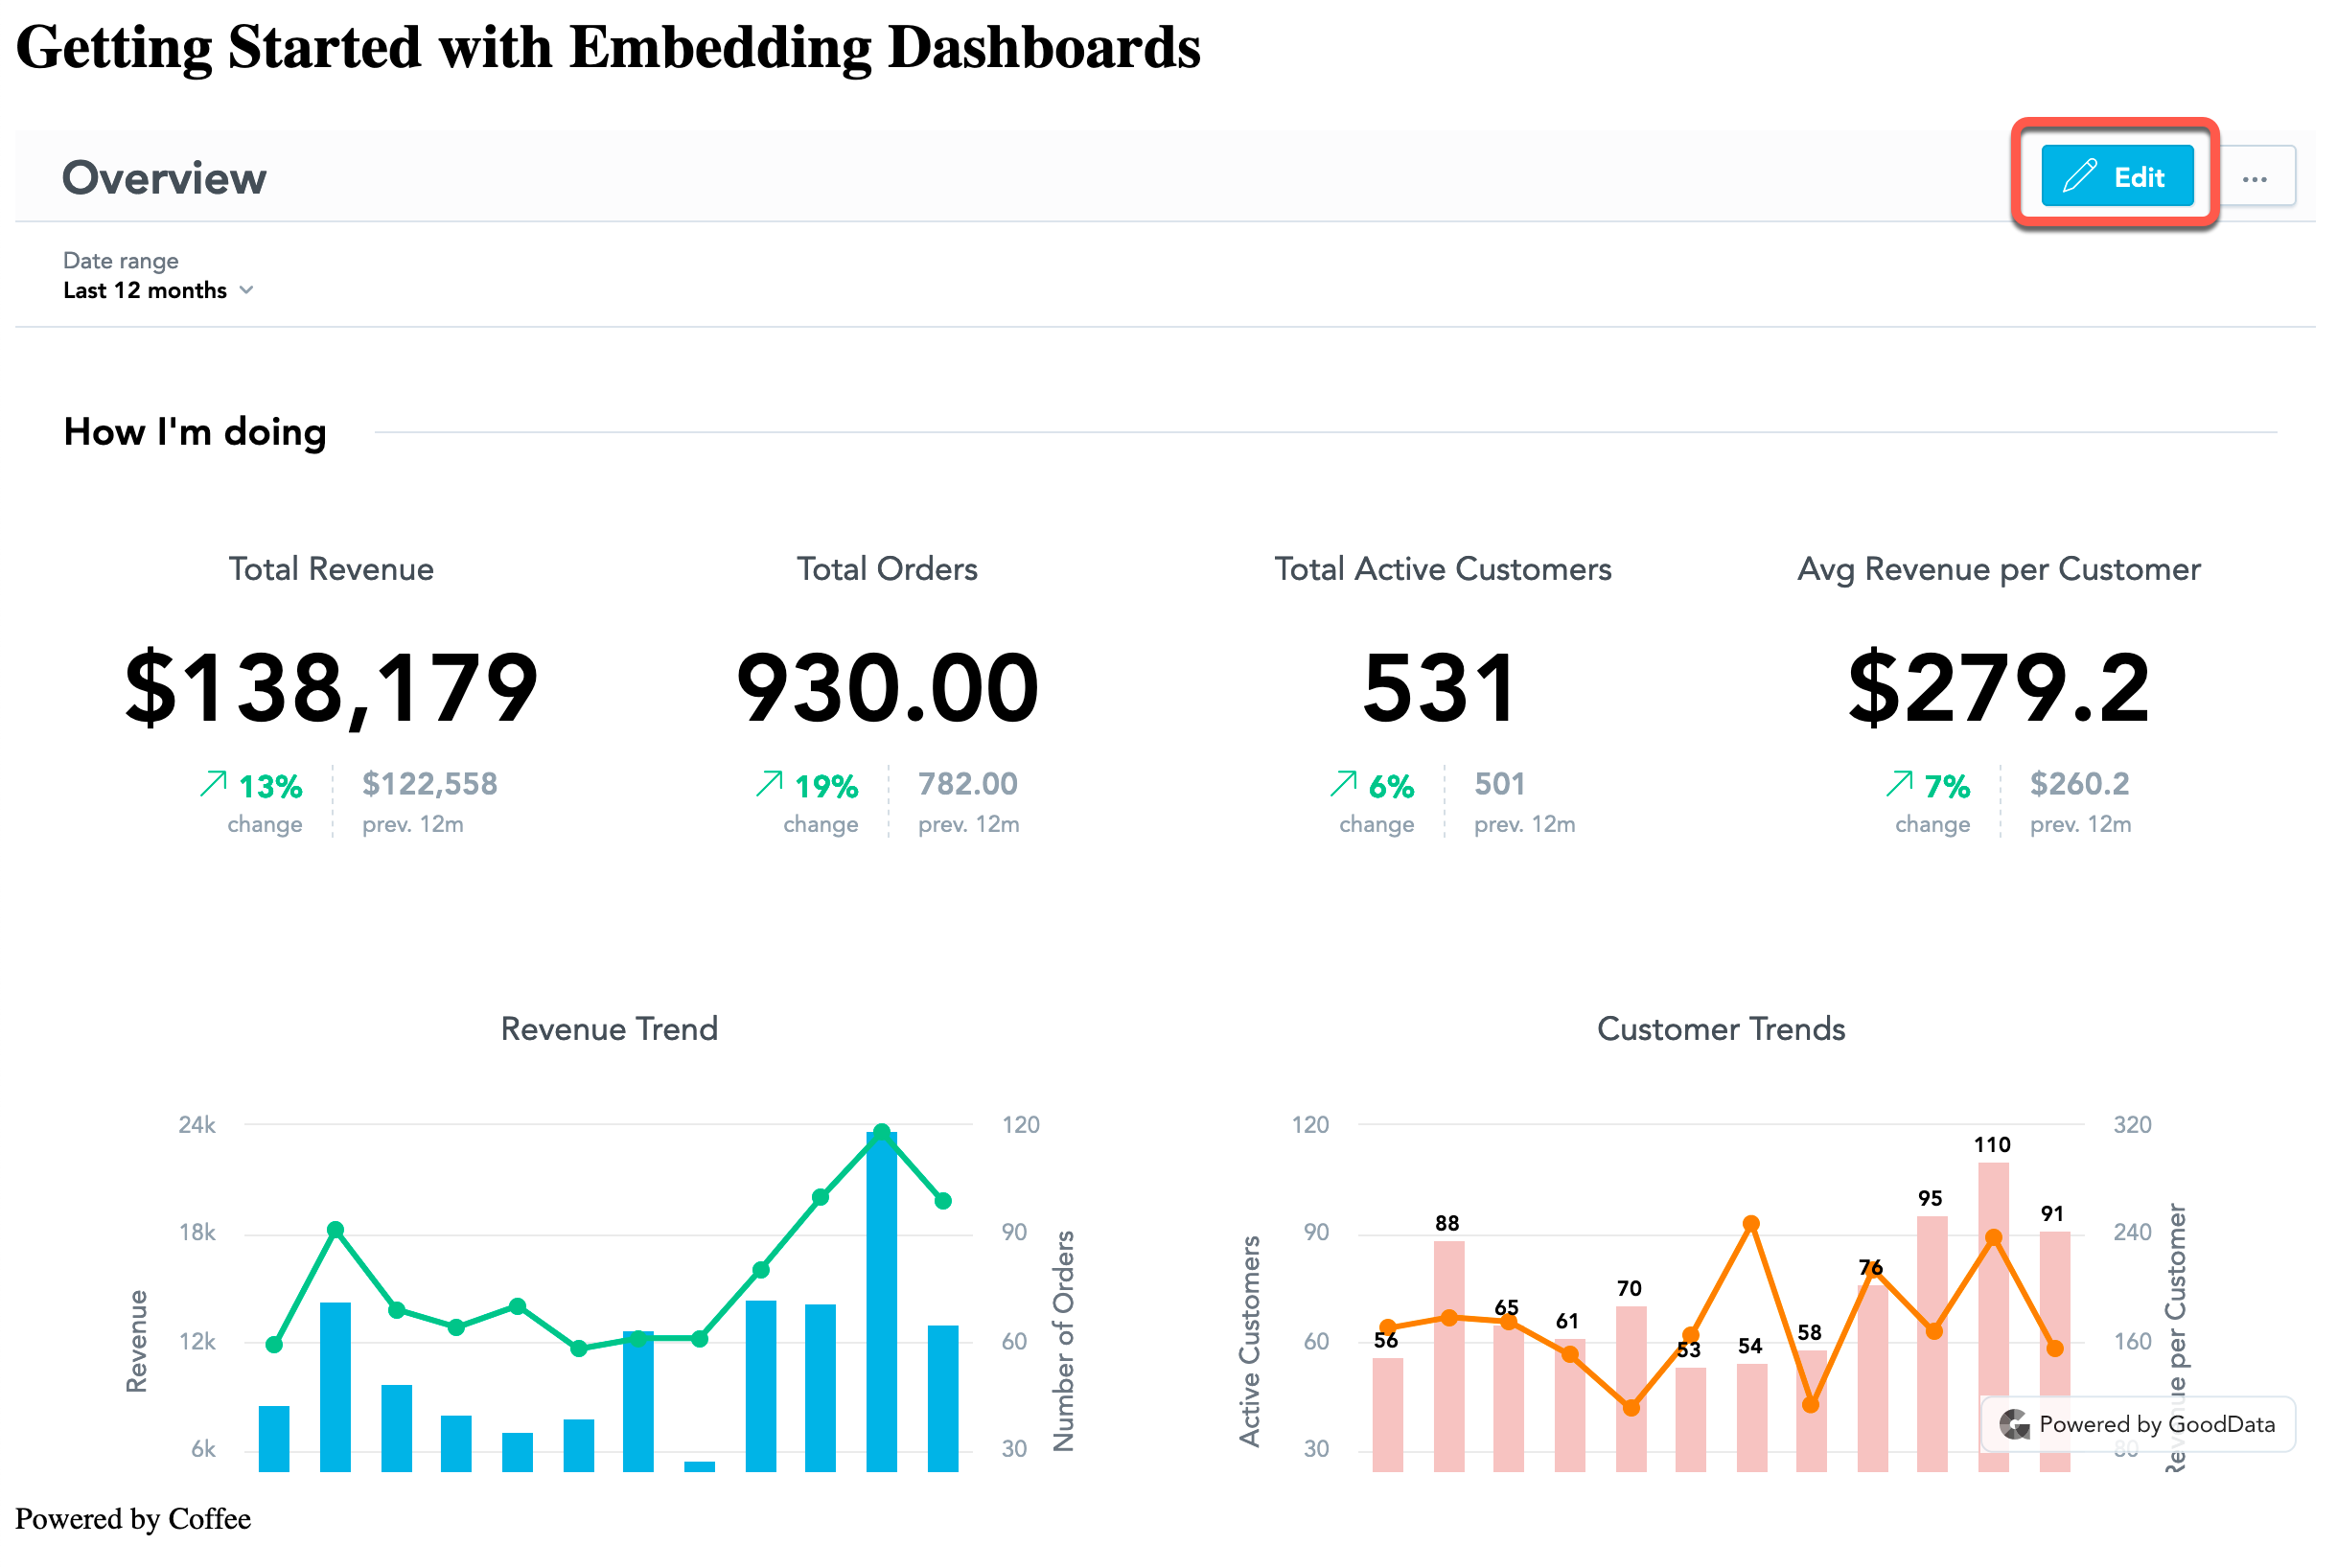
When the Edit view opens, you can modify or delete individual dashboard elements.
Advanced Embedding Options
This guide describes only the simplest embedding scenario.
In production environment, you may want to use complex and more robust embedding forms and exercise more control over what your clients can access. Some of the options you have include the following:
- Control which catalog objects are displayed to your users.
- Listen to events users perform in Analytical Designer and respond in your application.
For advanced options, see Embed a Dashboard in our main documentation set.