Build Dashboards
The Dashboards section allows you to quickly create comprehensive overviews with key data and trends visualizations.
Data in the Demo Workspace is date-based and refreshed on regular basis. The actual values displayed in your dashboards may be different.
You can:
- Create visual representations of individual insights and quickly filter them by attributes or dates.
- Quickly drop insights onto the canvas and further modify them to maximize the information value for the target audience.
- Share dashboards and download them as PDFs.
You access Dashboards by clicking the Dashboards tab in the main navigation bar.
Build your First Dashboard
In this scenario, you want to see the big picture of the sales in Home and Outdoor categories - trend in revenues, individual products' viability, etc. in the context of overall revenue.
In Create an Insight, you built the Revenue by Quarter insight that we encouraged you to further refine into Revenue in Home and Outdoor. You will now use them to create a simple dashboard.
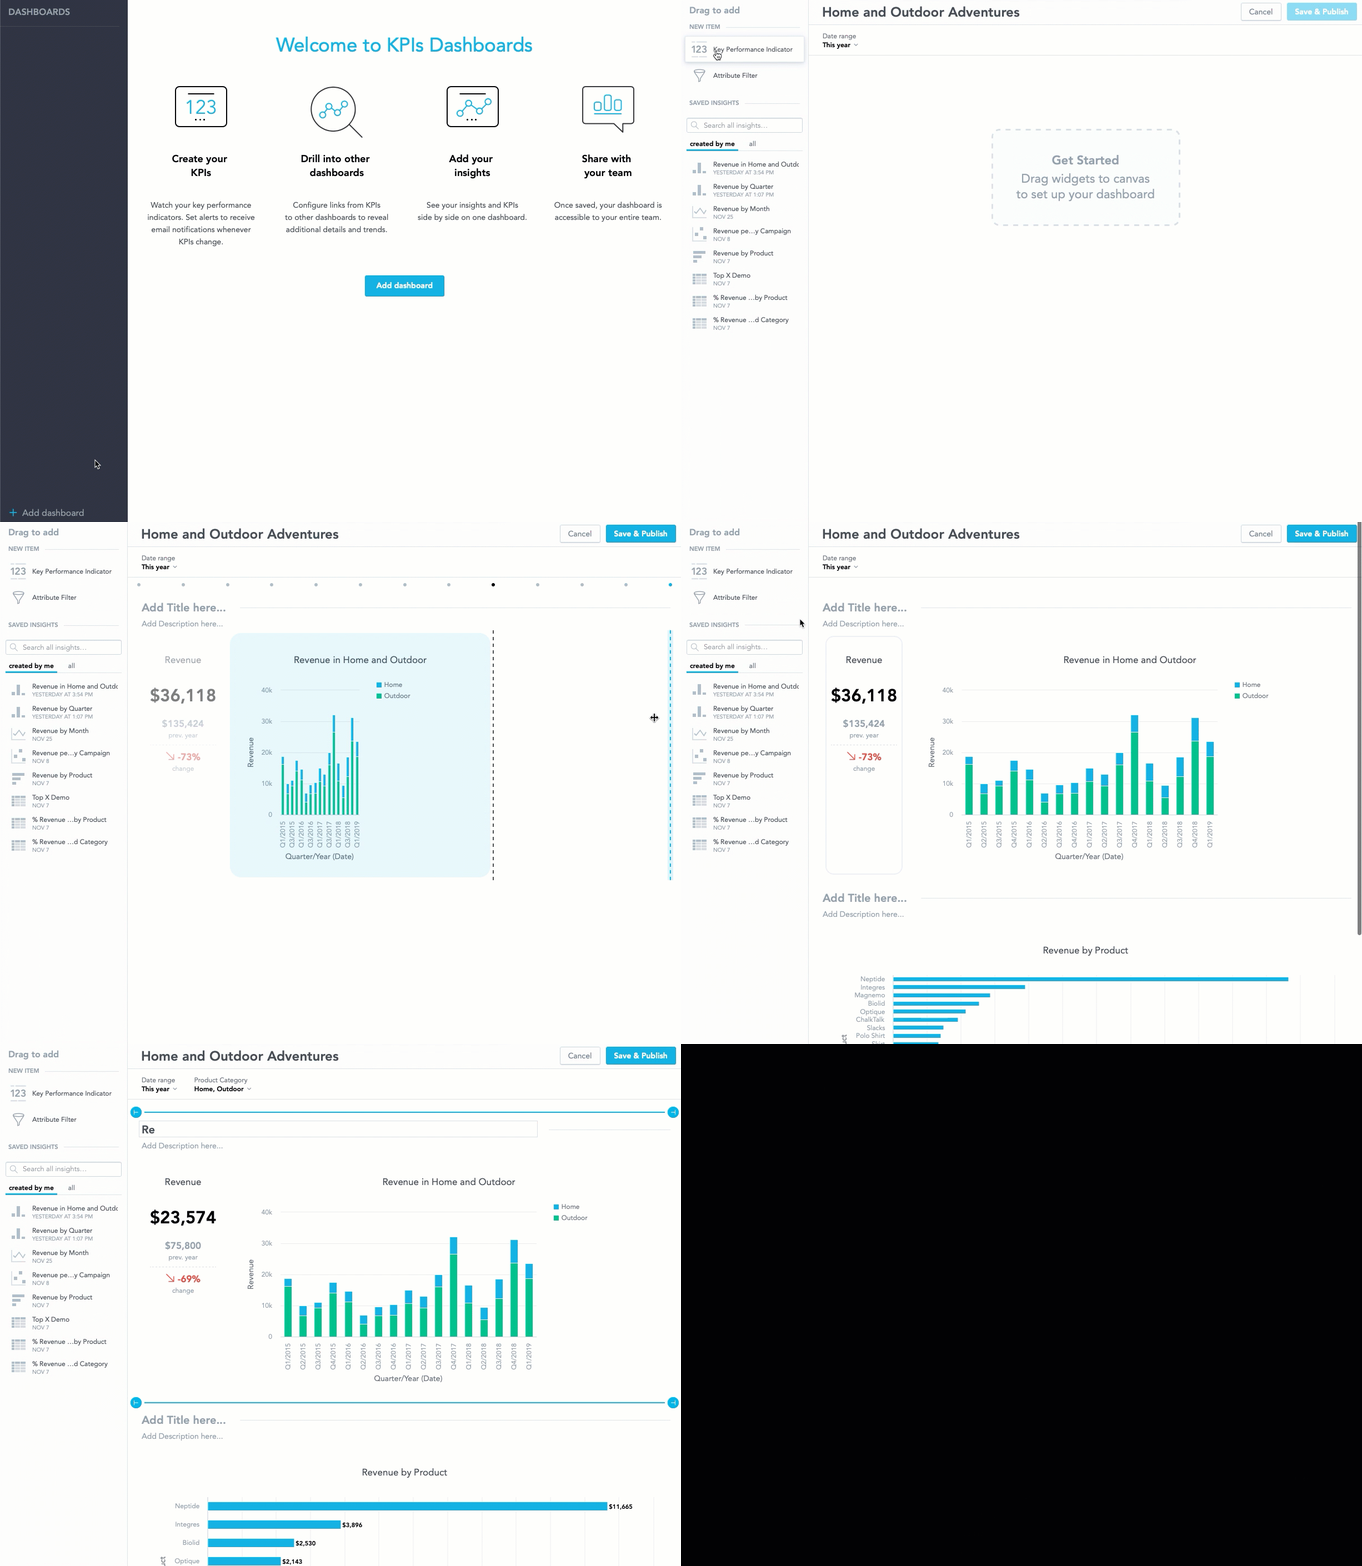
Review the animation to see the process, then follow the procedure:
Steps:
- In the Dashboards tab, click Add dashboard.
- Click Untitled and name the dashboard Home and Outdoor Adventures.
- Click Date range, select This year, then click Apply.
- From the left Drag to add pane, drag the Key Performance Indicator widget onto your dashboard canvas.
- In the dropdown menu that appears, select Revenue. The widget automatically updates to display the overall Revenue for this year, previous year and the change in percent.
- In the SAVED INSIGHTS section of the Drag to add pane, find the Revenue in Home and Outdoor insight and drag it onto the canvas. Resize it to fit the width of the canvas by dragging the right edge to the right.
- In the SAVED INSIGHTS section of the Drag to add pane, find the Revenue by Product insight and drag it onto the canvas. Resize it to fit the width of the canvas by dragging the right edge to the right.
- From the left Drag to add pane, drag the Attribute Filter to the area next to the Date range.
- From the drop down menu that appears, select Product Category.
- Click the widget, untick Clothing and Electronics, then click Apply. The widgets automatically update.
- (Opional) Click the names of the individual Dashboards and sections to rename them.
- Click Save & Publish.
Edit and Share Your Dashboard
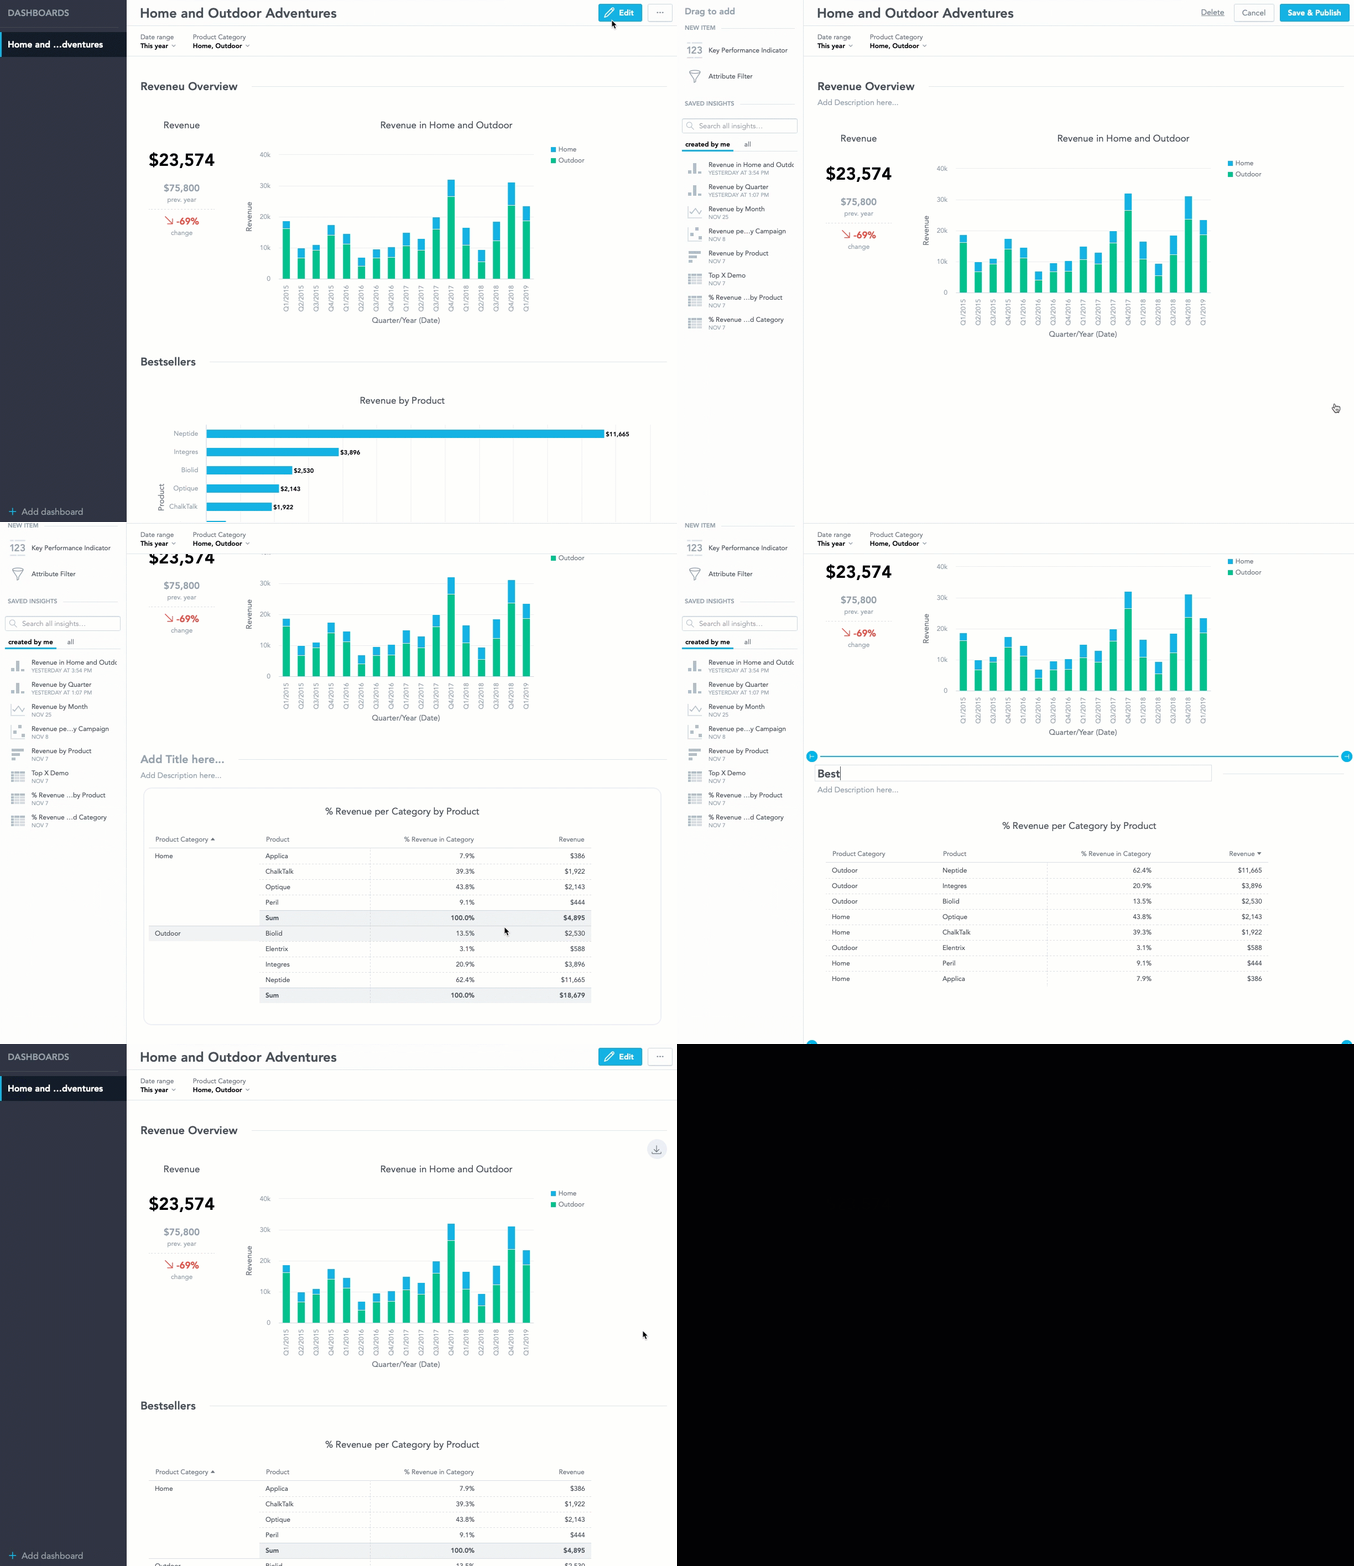
Data in your dashboards are updated automatically. However, you can edit the dashboard to fix errors or modify insights at any point.
As you can see, you can still work with certain visualization types, such as tables, and arrange data in columns both in the Edit and the View mode.
Once you save a dashboard, you can export it as a PDF:

You can also download data from individual insights as XLSX and CSV files:
Next Steps
We encourage you to experiment with widgets and settings to discover possibilities of the Dashboard building tool. For comprehensive advanced guides and feature description, see Dashboards.


