If Too Many Date Dimensions, Try Events
Time can have several different meanings in analytical projects. For example, an opportunity can be associated with the time when it was created or the time when it was closed.
There are many common examples of data models containing multiple times associated with a single entity (e.g. help desk tickets or flights).
The following diagram shows a typical example of a simple sales model that uses created and closed date dimensions:
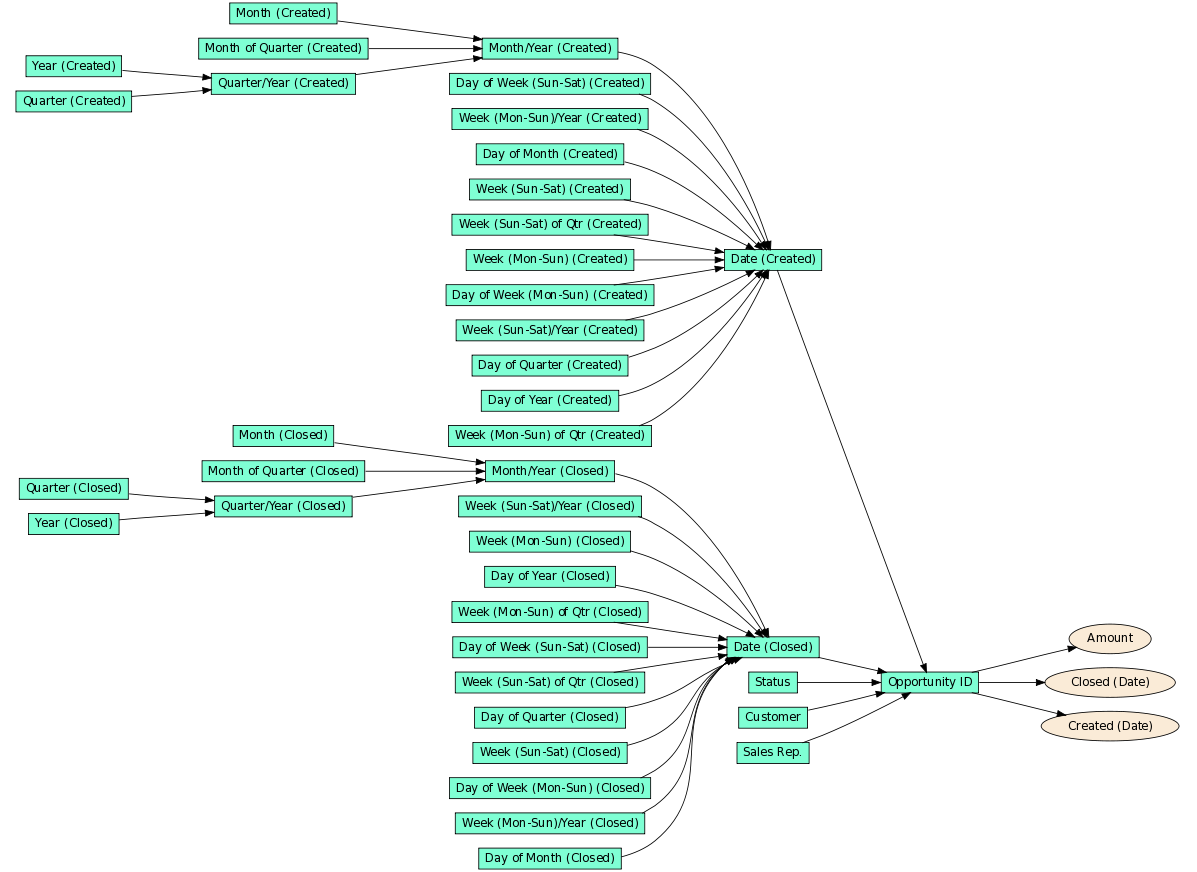
Problem - Multiple versions of time cannot be used together
At a fundamental level, end-users of projects may have difficulty understanding why there are two date dimensions and which one to use in their reports. If they are not paying close attention to the labels of the date, they may think that all date dimensions are the same. They are not.
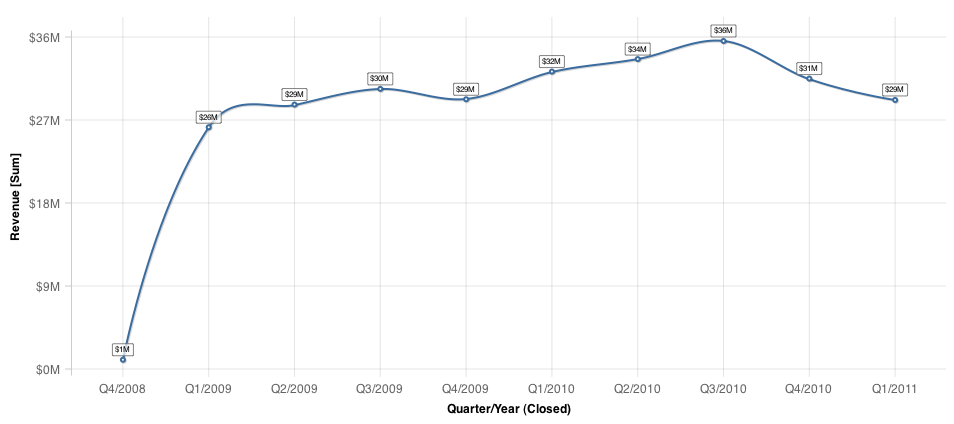
End users may encounter another problem. It is easy to create a report Revenue by Time that is sliced by the Closed Date.
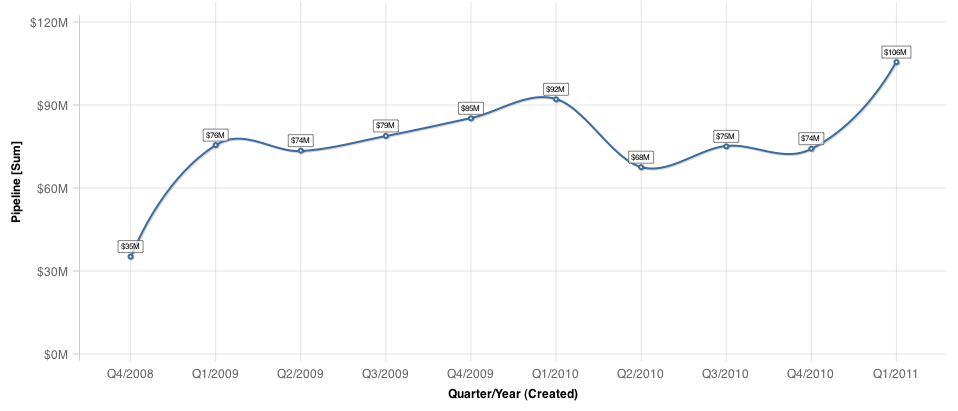
You can also create a report Pipeline Generation by Time that is sliced by the Created Date.
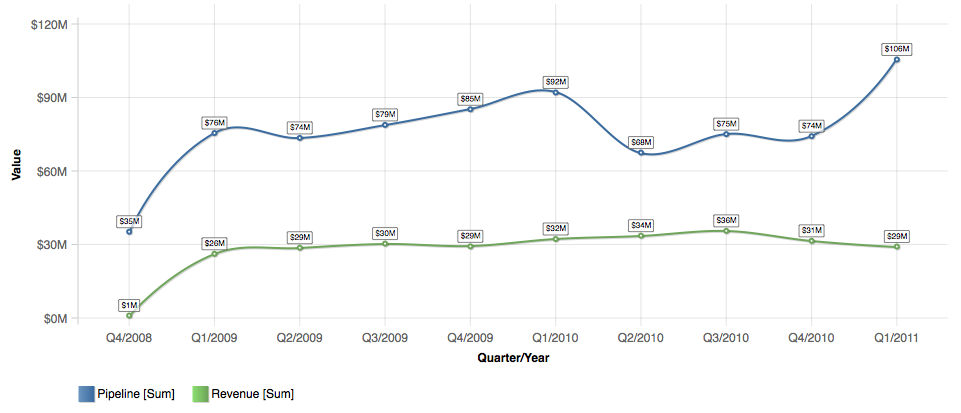
Since the first report uses the closed time dimension and the second report uses the created time dimension, you cannot add them to a single chart, as you would like in the chart below.
Solution - The Event Data Model
To build the report listed above, you must build your analytical data model differently, using event data structures.
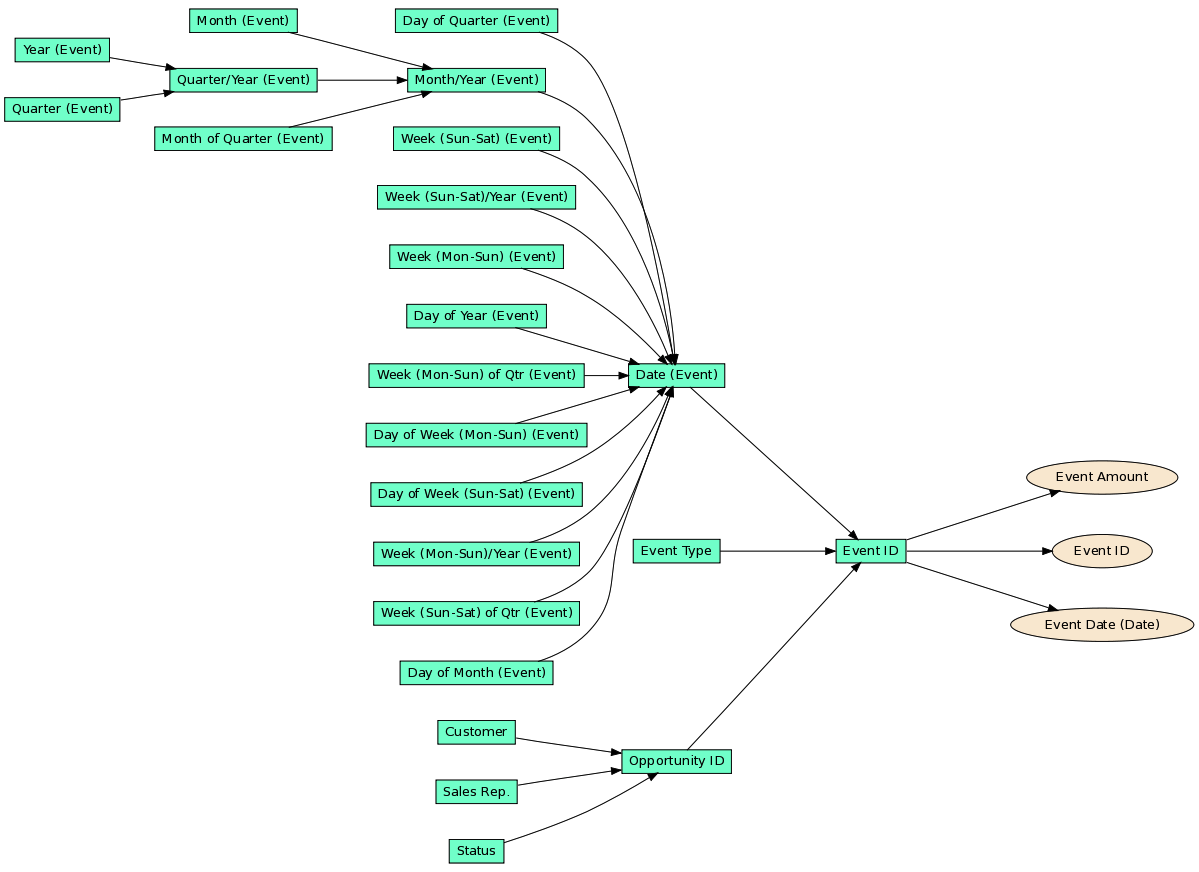
A special Event dataset can be created to contain all events related to a specific opportunity. In this case, there are two events per opportunity: created and closed. In other use cases, the event dataset might contain even more events to cover the entire life cycle of the data.
Because there are two events per opportunity, the Event dataset contains twice as many records as the original Opportunity dataset.
If you are modifying an existing dataset to support multiple time-based events, all existing metrics that reference dates must be modified, so that the number of returned values are not multiplied by the number of events (two in this case).
Some example metric definitions are listed below:
Pipeline [Sum]:
SELECT SUM(Event Amount) WHERE Event Type = created
Revenue [Sum]:
SELECT SUM(Event Amount) WHERE Event Type = closed AND Status IN (Won)
Lost Revenue [Sum]:
SELECT SUM(Event Amount) WHERE Event Type = closed AND Status IN (Lost)
These metrics are relatively simple. The metrics that compute that last opportunity value are a bit more complicated, as the ‘latest’ available event for each opportunity in the Event dataset must be found.
The data model must support the Event ID FACT. This fact contains a unique ID for each event.
When the Event ID is defined, higher values for it indicate that the corresponding event occurred later in time. So, the maximum Event ID for a specific opportunity identifies the latest event for that opportunity. MAX ID must be computed first:
Last Opportunity Event ID:
SELECT MAX(Event ID) BY Opportunity ID ALL IN ALL OTHER DIMENSIONS
Then, the current (latest) opportunity amount, revenue, and pipeline are computed:
Current Amount [Sum]:
SELECT SUM(Event Amount) WHERE Event ID = Last Opportunity Event ID
Current Revenue [Sum]:
SELECT Current Amount [Sum] WHERE Status = Won
Current Pipeline [Sum]:
SELECT Current Amount [Sum] WHERE Status = Open
Current Lost Revenue [Sum]:
SELECT Current Amount [Sum] WHERE Status = Lost
As you can see in the preceding example, there is a bit of work to do in order to change your metrics to support event-based date management. However, when events are implemented properly, multiple metrics sliced by date can be more effectively represented in a single graph.
Start considering this data model design when you are creating the 6th date dimension in your project.