Date Attribute Arithmetic
You can use data arithmetic when you are computing sales velocity, support ticket response times, or any other duration metric.
GoodData now supports arithmetic applied directly to date attributes. This reduces LDM complexity, improves reporting performance, and streamlines metric definitions.
To create a duration metric with date attributes, subtract the start date from the end date at the desired level of granularity (date, week, month, quarter, and so on).
SELECT Date (End Date) - Date (Start Date) BY [connection point]
The [connection point] represents the primary key of the data set to which the date dimensions belong. The BY statement specifies the granularity at which the date arithmetic is being carried out.
Examples
Event duration
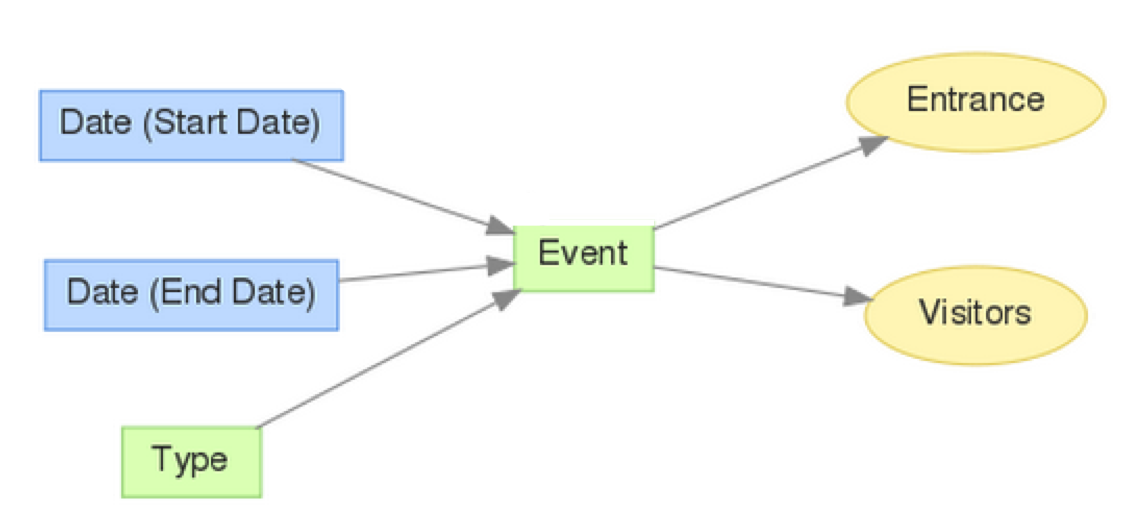
You want to measure the duration of events. The events have a start date and an end date.
To specify that the metric should be aggregated at the event level, add the event attribute to the report from the How pane.
The resulting report displays the event duration metric broken down by event.
Average event duration
To compute the average event duration, the metric must:
- Compute the duration for each event.
- Return the average of these duration values.
To compute the duration of each event , subtract the start date from the end date and add the statement that specifies that the duration being computed is for each individual event:
SELECT Date (End Date) - Date (Start Date) BY Event
To return the average, wrap the metrec within an average function:
SELECT AVG((SELECT Date (End Date) - Date (Start Date) BY Event))
The inner metric in the syntax above is known as a sub-metric, which in MAQL is always surrounded by double parentheses. If you define the sub-metric separately and reference it within another metric, use single parentheses:
SELECT AVG(Event Duration)
In this case, the Event Duration metric is pre-defined, and has the following syntax:
SELECT Date (End Date) - Date (Start Date) BY Event
To keep the MAQL syntax simple and error-free, define sub-metrics externally and then reference them, as demonstrated above.
The result of the new metric is a single metric value that represents the average event duration.
Remove the event attribute from the report and change the visualization mode to Headline to display a single number:
To see the Average Event Duration for each Type of event, add the Type attribute to the report:
Handling Empty Values
Empty date values are converted to zeroes (0), which may deliver unexpected arithmetic results.
If your source data may contain empty values, create a flexible metric to remove the empty values from the computation. For example, you have the following metric:
SELECT AVG(Merchant Live Date-Merchant Create Date)
Empty values for either of the date values generate zero values, which would create disrupting outliers to the overall average computation.
You can modify this metric calculation to remove empty date values using the following custom metric:
SELECT AVG((select Date (Merchant Live Date) - Date (Merchant Create Date) BY Estore ID
  WHERE Date (Merchant Live Date)   <> (empty value)
    AND Date (Merchant Create Date) <> (empty value)))


