Filters in the GoodData Legacy
Sometimes you want to analyze only a subset of your data. To achieve this you can use filters. In the GoodData platform, you can apply filters at any of the three stages of your analysis:
- when you modify your metrics
- when you build insights
- when you display Dashboards
Metric level filters limit what data enters that specific calculation, insight level filters limit what data is available to all metrics and attributes in that insight, Dashboard level filters limit what data is available to all insights on that dashboard.
Only certain user roles can create and edit metric and insight level filters but all roles can change Dashboard level filter selections. This gives you a wide array of options to filter data for your specific use cases.
To learn how to apply filters in your data analysis, see Filter Expressions.
Filter metrics
When you create or modify metrics using filters, you define how your data are used for the analysis. By applying filters at this stage, you exclude specific range of data from being used for computation.
To create or modify a metric you need to have at least editor level access to a workspace. See User Roles.
To learn more about creating filters and metrics, see MAQL - Analytical Query Language.
In the following example, you will add a filter to the # of Orders metric to see only delivered orders:
Click Manage, then click Metrics.
You can either create a new metric or edit an existing one.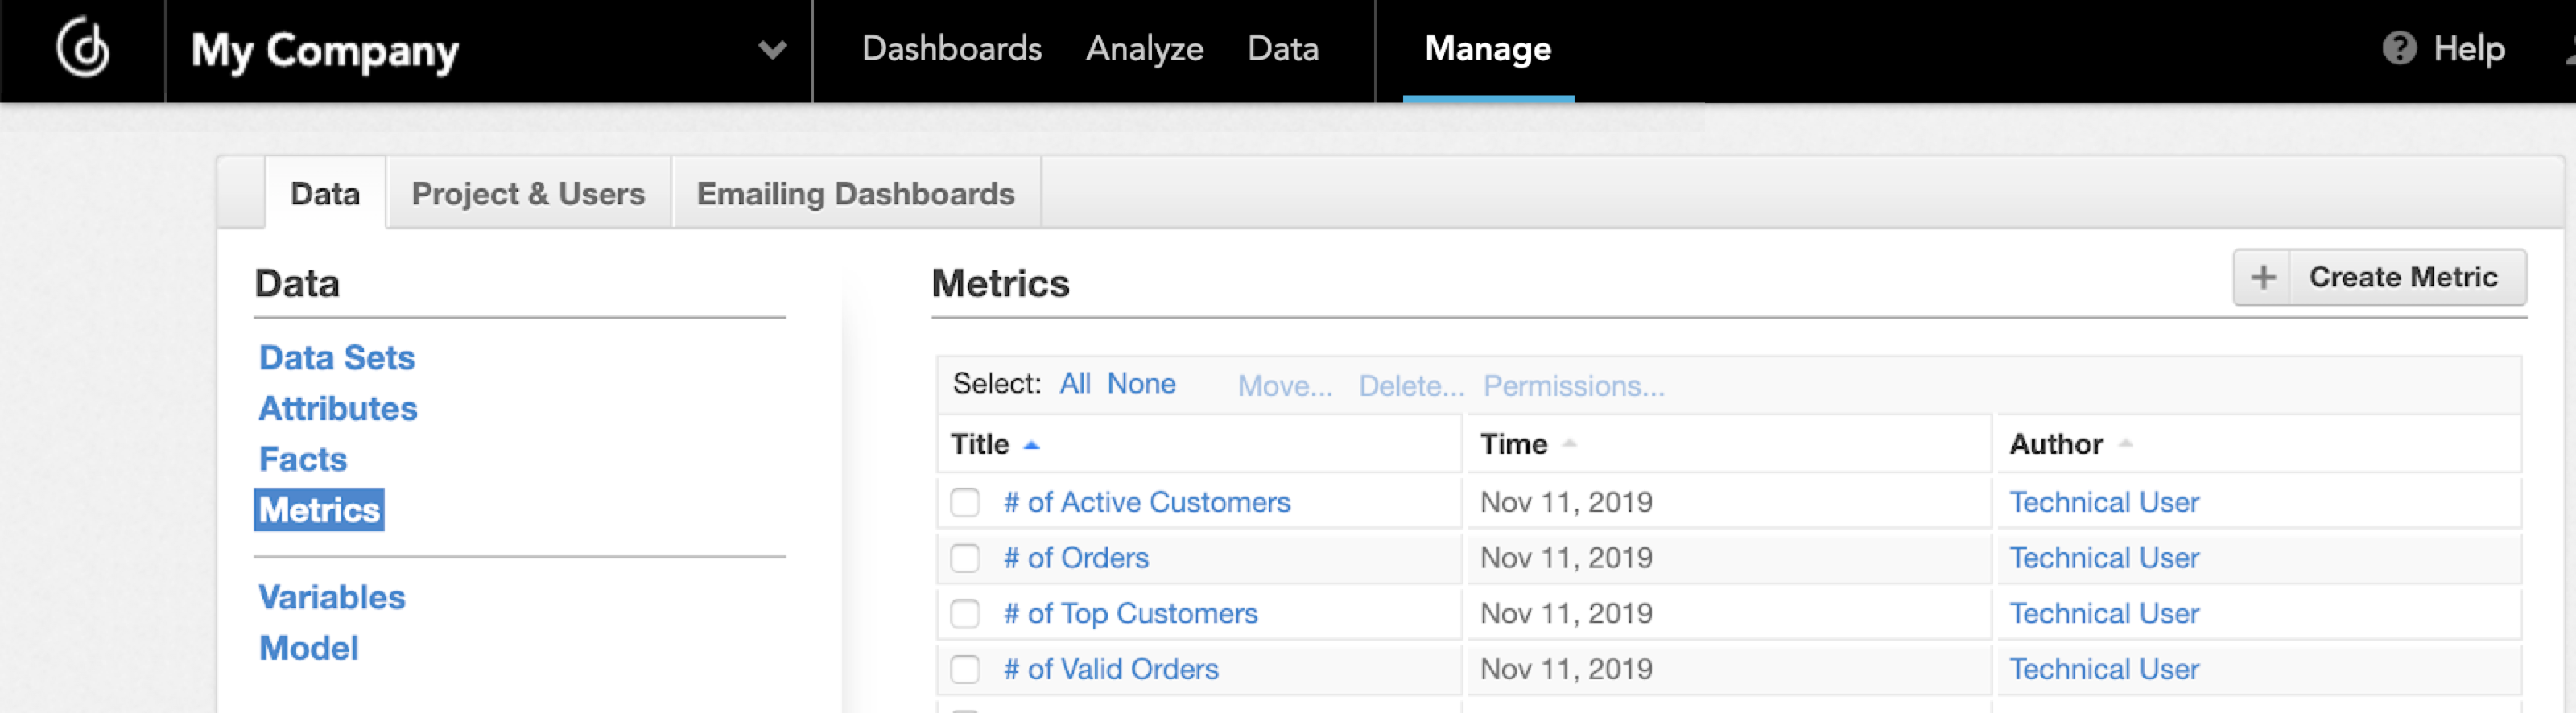
To start editing the metric click its name and, when the following screen appears, click Edit.
MAQL metrics editor opens. This is where you change the definition of the metric.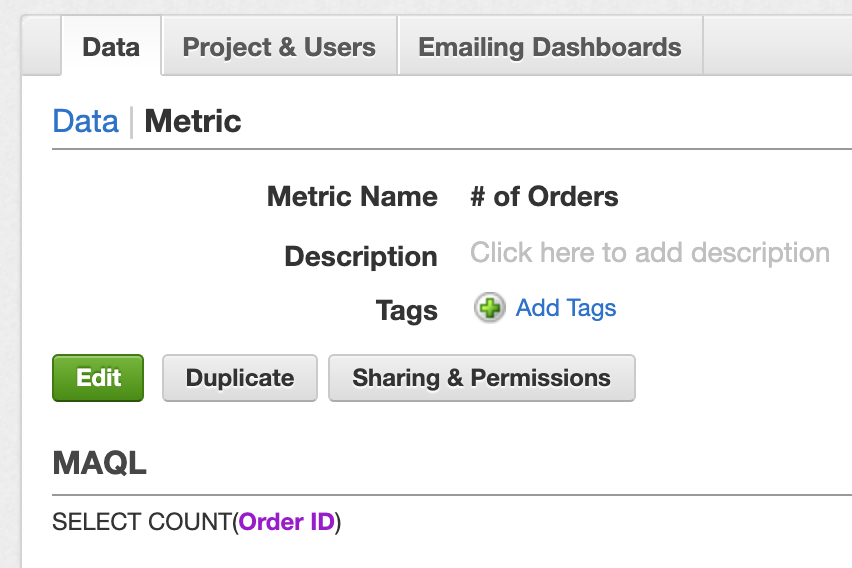
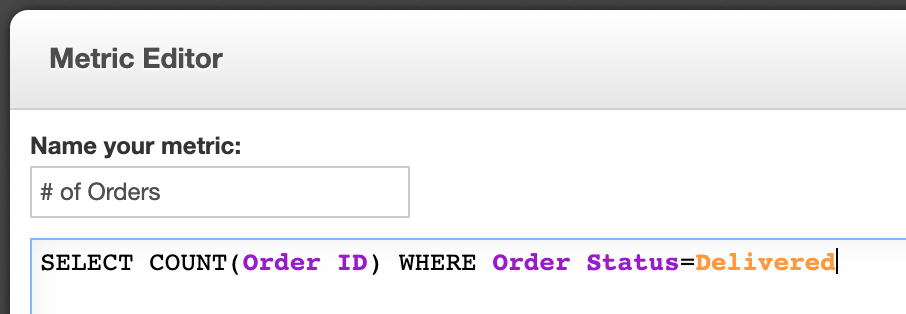
Edit the definition and add a filtering condition to it.
SELECT COUNT(Order ID) WHERE Order Status=DeliveredSuch conditions always start with WHERE keyword (see Filtering with the WHERE Clause).
Save the expression. You can now use it in your insights.
Using Filters in Insights
Another level where you can apply filters is Analytical Designer where you can apply filters in insights. By applying filters on insights, you exclude specific range of data from being used for analysis.
To build/edit insights you have to have at least Explorer role. See User Roles.
In the following example, you will add a filter to # of Orders by the Product Category to count only the orders that were delivered.
You have two options here:
- use an existing metric just like the one that you created in the previous section
- use an insight level filter
To use an insight level filter:
- Drag and drop an attribute from the list of attributes to the filter section:
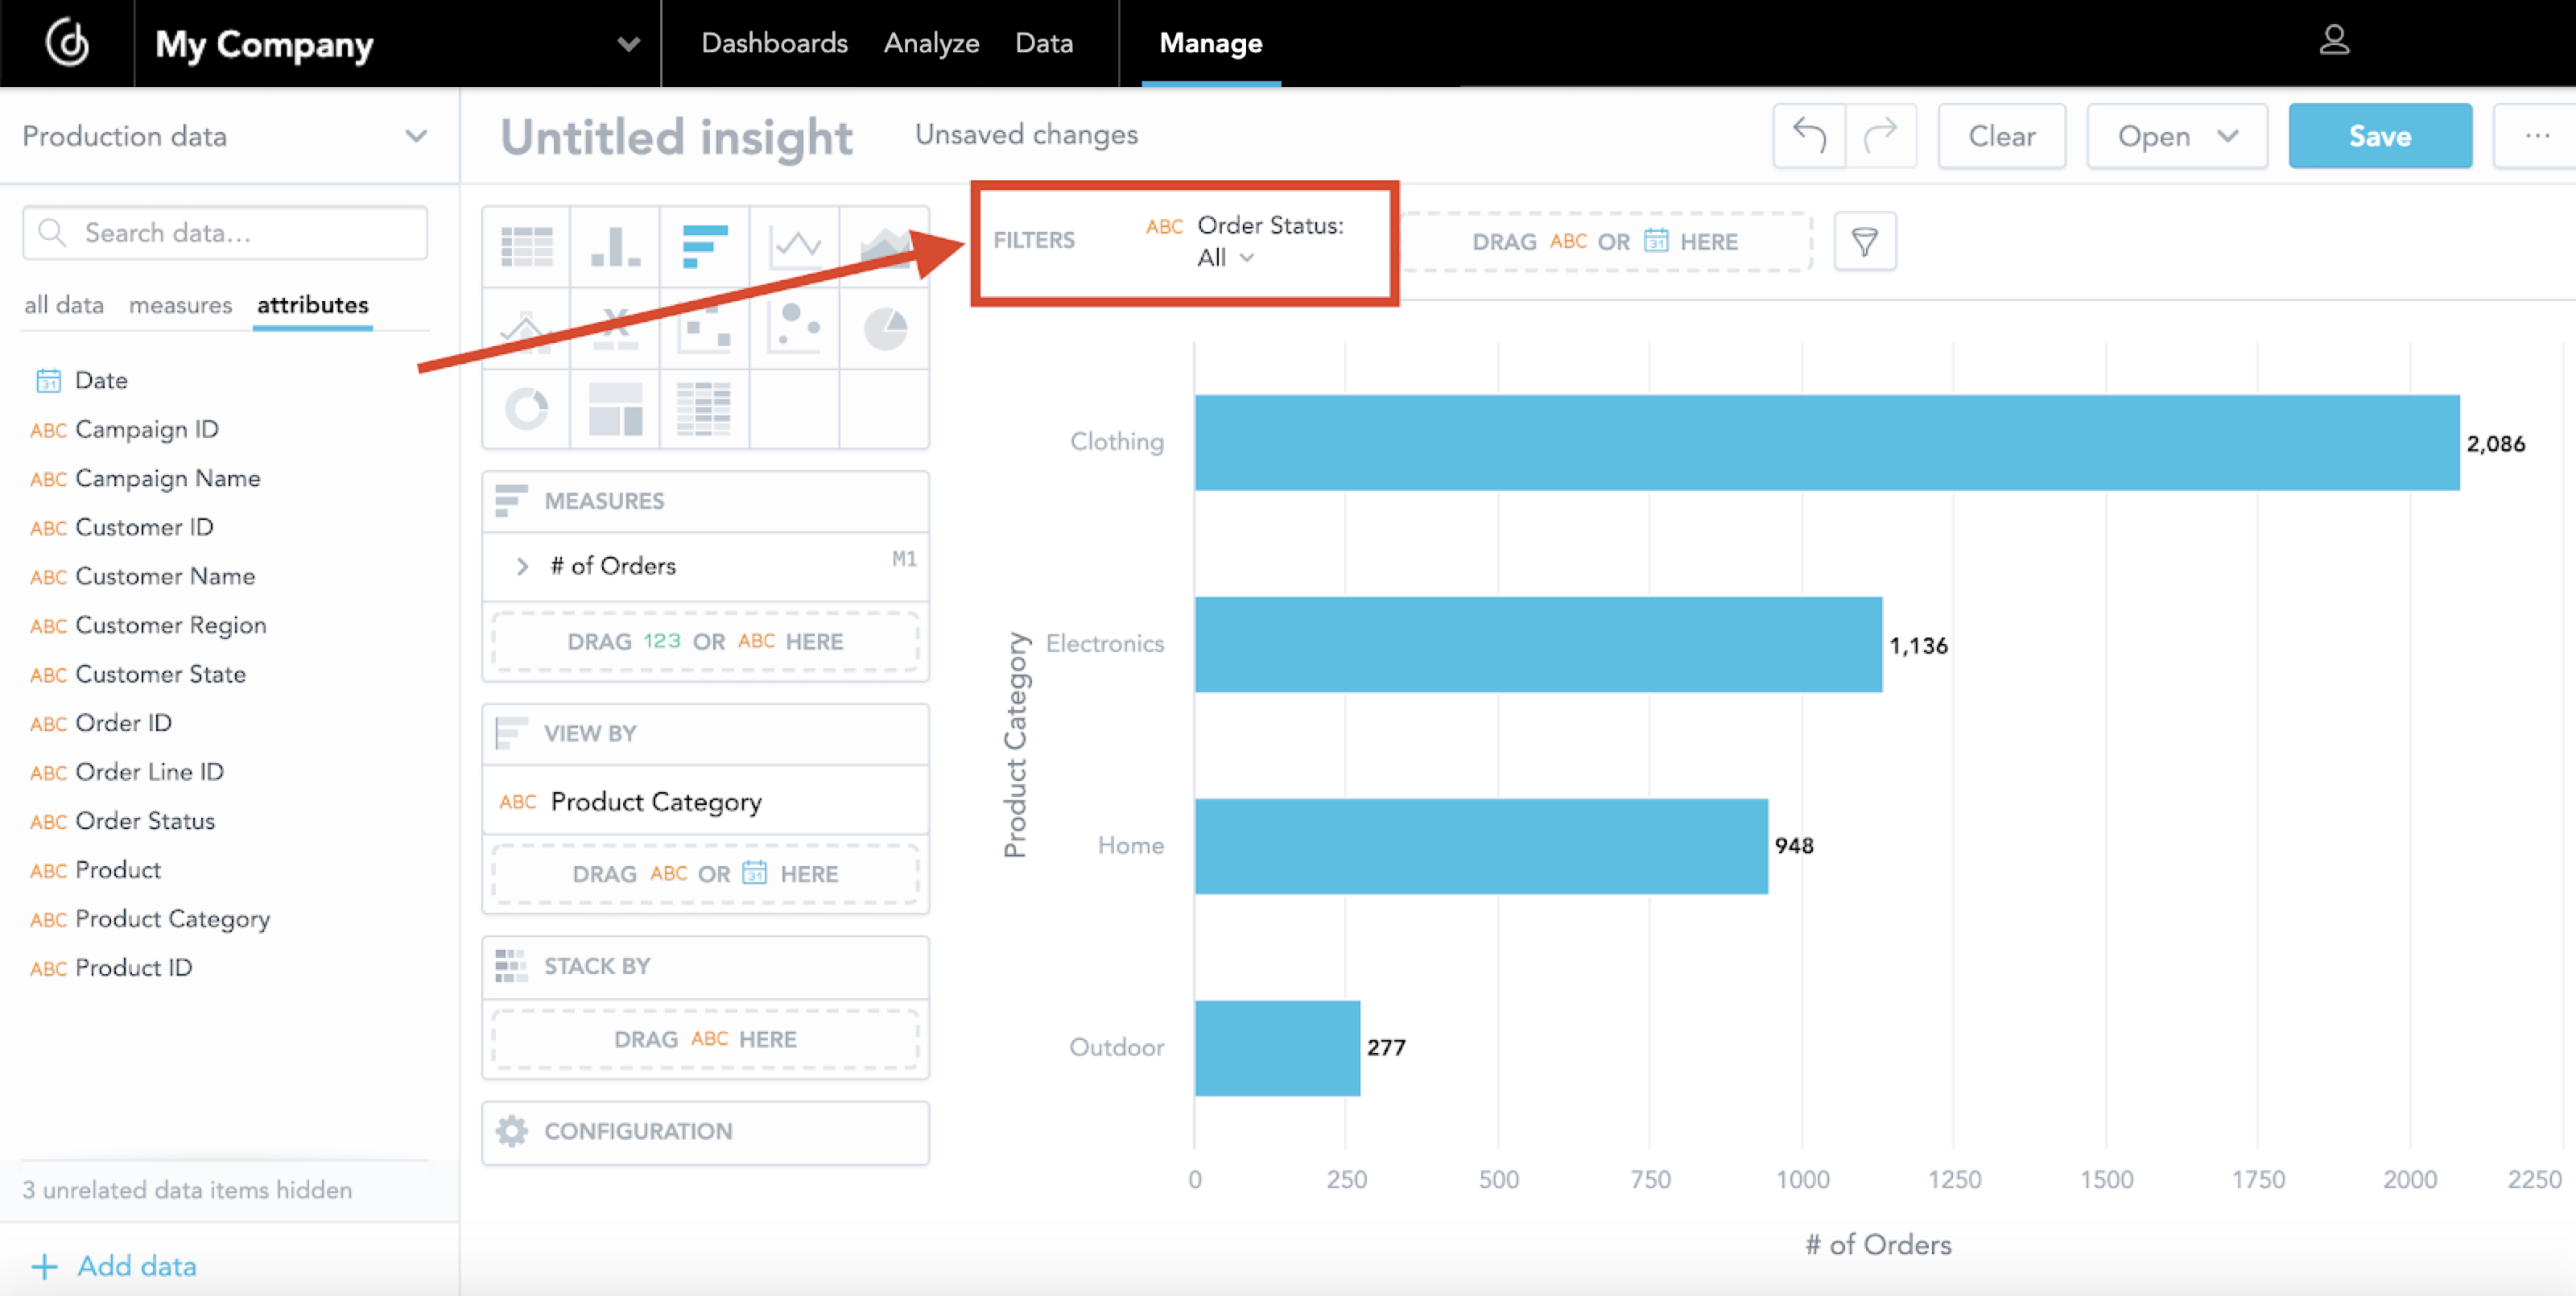
- Select the value that you want in the filter.
The chart recomputes itself.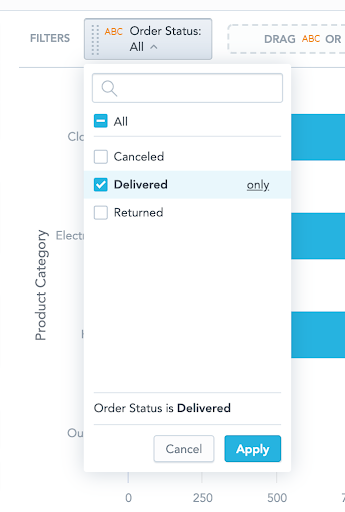
When you save the insight, the filter and the selected value will be saved along with it.
For more details, see Filters in Analytical Designer.
Using Filters in Dashboards
Another option you have is to use Dashboard filters. By applying filters on Dashboards, you hide a specific range of data from being displayed on the dashboard.
Any viewer can apply dashboard filters.
There are two kinds of filters available for Dashboards:
- attribute filter
- date filter - to learn more, see Date Filters in Dashboards
Using Dashboard Filters
To use filter only on Delivered orders, use an attribute filter instead of the metric or insight level filter.
Steps:
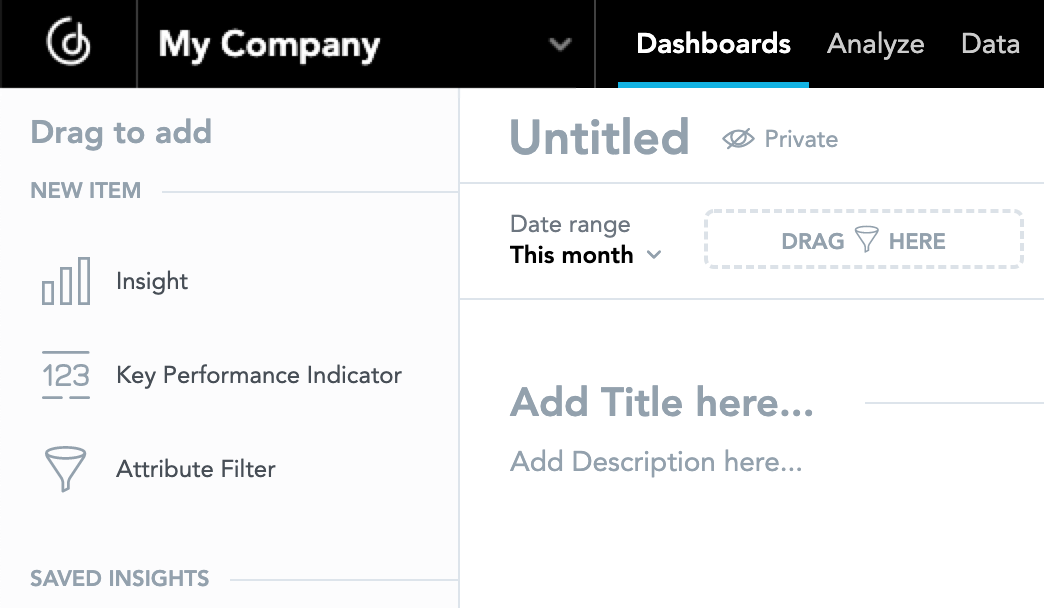
- Switch to the edit mode on a dashboard.
- Drag and drop the Attribute Filter component next to the default Date range filter component.
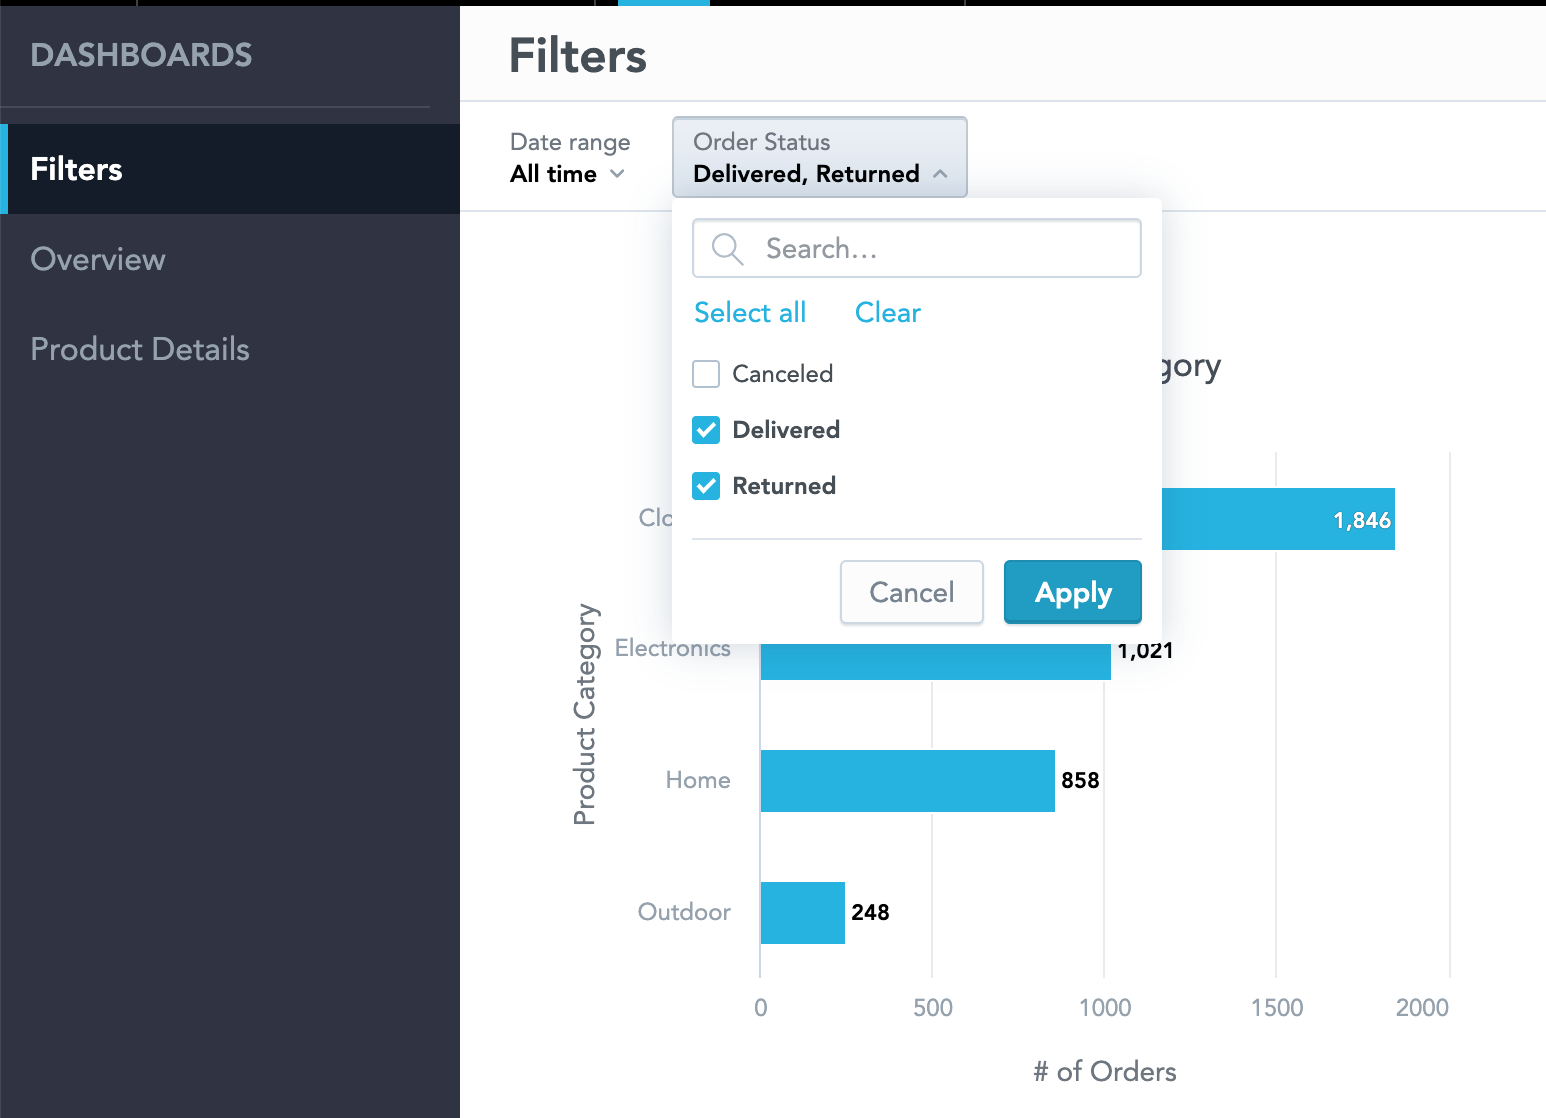
- Select
Order Statusattribute from the drop-down menu of the Attribute Filter component.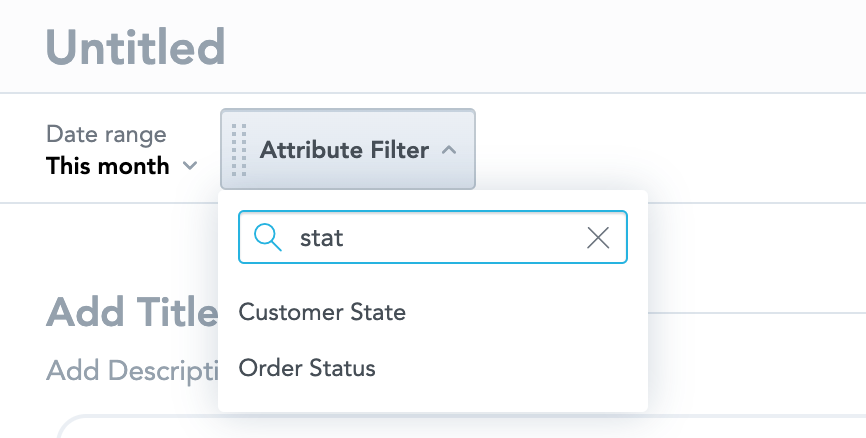
- After you selected the attribute, you can choose which values should be selected by default when a user views the dashboard.
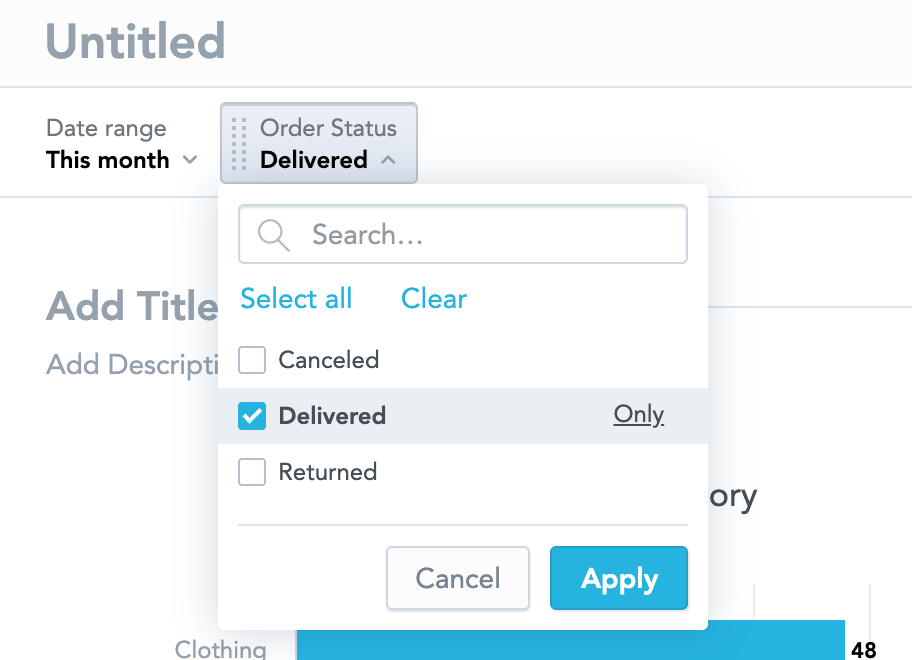
- Click Apply.
Advantages of Dashboard Filters
All users, even viewers, can change dashboard filter values. As a result, any user will be able to change the selection from, for example, Delivered to Returned, or select all values.
This selection does not modify the default values set, it only applies filters within that user’s session and will reset next time the user visits the dashboard. In some cases this is what you want. In different scenarios, you do not want viewers to change the selection. In that case, use a metric or insight level filters instead.
Another feature of all dashboard-level filters is that you can select which insights the filters should apply to.
By default, all filters apply to all insights you placed on the dashboard. If you want to prevent a specific filter from applying to a specific insight, simply click the insight and uncheck the filter that you want it to ignore.
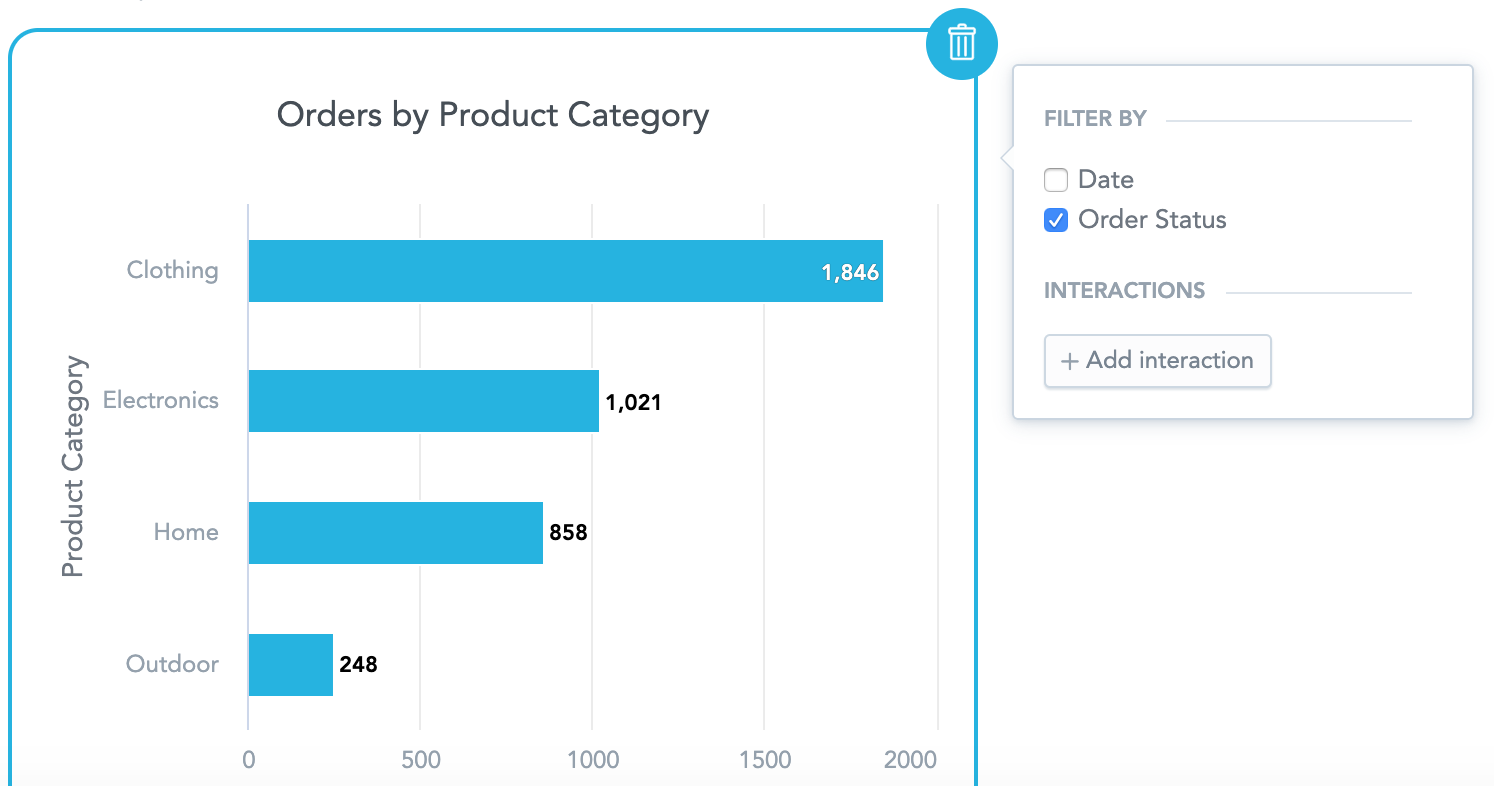
In the example above, we unchecked the date.
Choosing the Right Filter Type
There are always exceptions but the best practices are:
- Use a metric level filter if you plan to use the same filtered metric in multiple insights. That way you only define the filter once instead of defining it over and over again for each single insight. Apart from easier maintenance, it also standardizes the definition for everybody.
- Use insight level filters if you have a very specific scenario that you are unlikely to use elsewhere, or if you are just quickly prototyping.
- Use a dashboard filter if you are putting your insights on a Dashboard and want to enable the consumers of the dashboard to dynamically change the filter value.
How do all these filters interact?
All filters that apply to an insight - no matter what level they are defined on - will be connected by AND operator. That means that a combination of the filters will apply and only rows of data that satisfy all the different filtering conditions will enter the calculation.
If, for example, the metric is filtered on Order Status = Delivered and the dashboard filters on Order Status = Canceled the insight won’t return any data as each order is associated with a single Order Status value in our case.
Common Pitfalls
You might get into a situation where you add a filter but it does not change the numbers.
This typically means that you are trying to filter on something that is not connected to the data points that you are using in your metrics/insights in the LDM (logical data model).
To learn more about the LDM Modeler and data modeling on the GoodData platform, see Data Modeling in GoodData.