Create Dashboards
Overview
On Dashboards, you can:
- Add insights from Analytical Designer (see Create Insights).
- Create and save new insights using Analytical Designer.
- Create Key Performance Indicators (KPIs) and configure them.
- Set up date and attribute filters for the whole dashboard and all its viewers. See also How the Dashboard Data Filter and Insight Date Filters Interact.
To add and create insights, you must have Analytical Designer enabled. If you do not have Analytical Designer, contact GoodData Support.
You can add as many dashboards to your workspace as you want, however, review your dashboards periodically and keep only those that are relevant to your users.
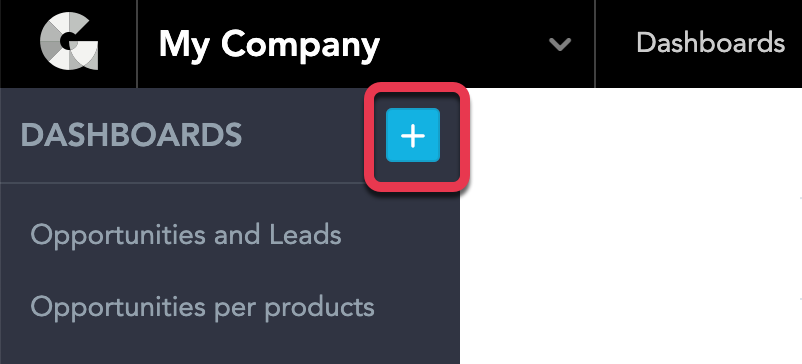
Create dashboards
On the workspace toolbar, click Dashboards. Click the plus icon to start creating a new dashboard.
Add insights
To add an already existing insight, drag the insight from the Saved insights list and drop it to the dashboard area.
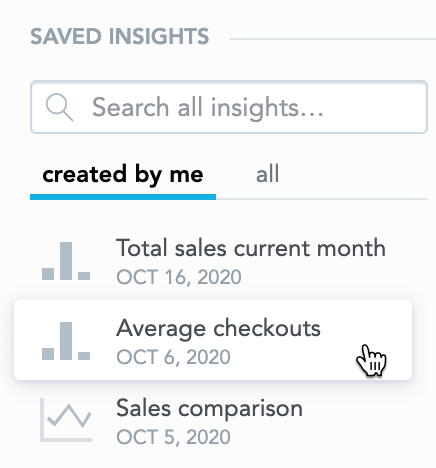
You can add insights created by you or shared with you. For details about insights, see Create Insights.
We recommend that you keep the total number of KPIs and insights on a single dashboard below 16 to avoid delays in computation.
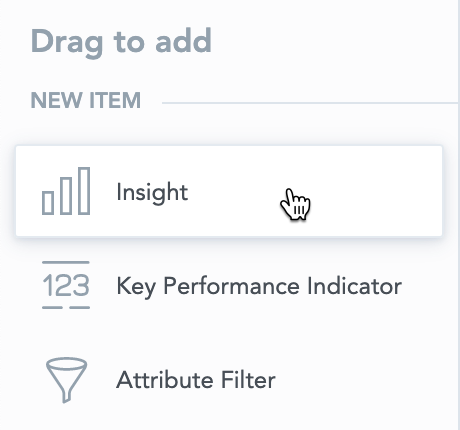
To create a new insight and add it to the dashboard, drag and drop the Insight item to the dashboard area. The Analytical Designer opens. Build your insight and click Save to automatically add it to the dashboard.
 For details about insight configuration, see Create Insights.
To add drilling to various targets, see:
To enable zooming in insights, click the insight on the dashboard, and select Interactions → Zoomable insight. For details, see Edit Items on Dashboards.
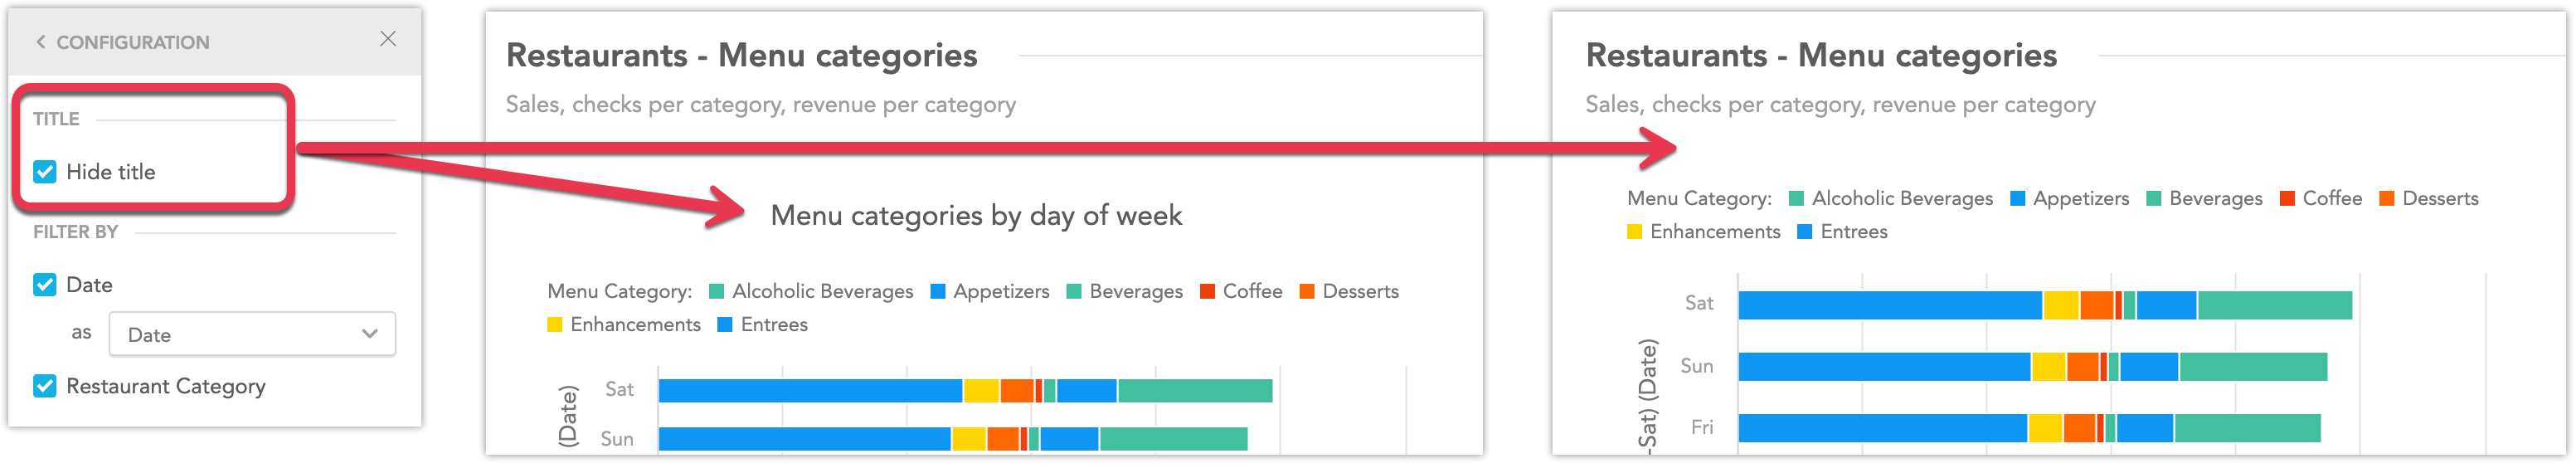
To hide the name of the insight on the dashboard, click the three dots → Configuration and select Hide title.
To enable this feature, set the
enableHidingOfWidgetTitleplatform setting to true. For details see Configure Various Features via Platform Settings.To change the description of a visualization, click the three dots → Configuration and select your option.
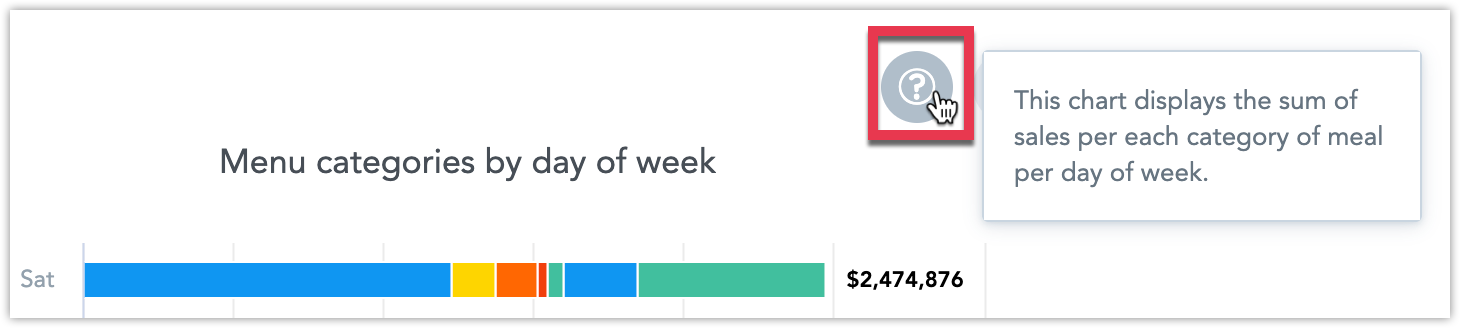
By default, the description is inherited from Analytical Designer. You can also add a custom text or disable the description from displaying.
The description is displayed when you click on the question mark next to the visualization name.
Add KPIs
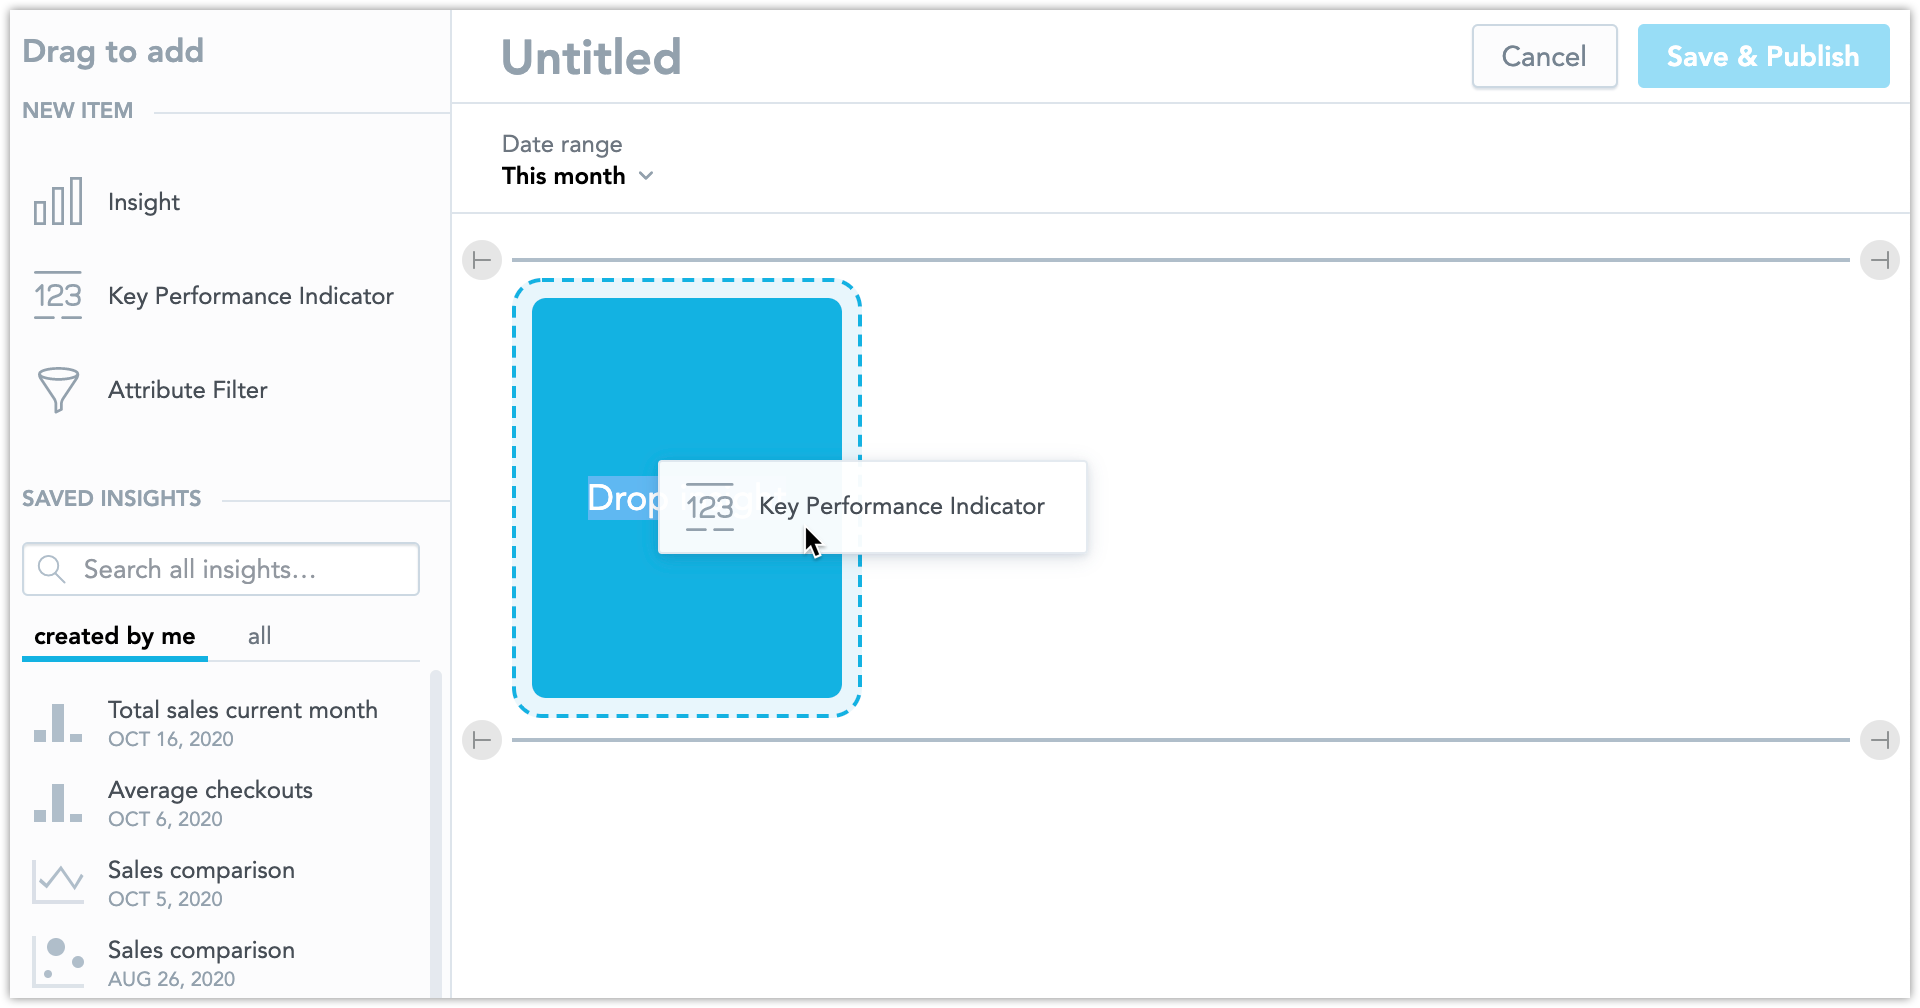
To add KPIs, drag and drop the Key Performance Indicator item to the dashboard area.
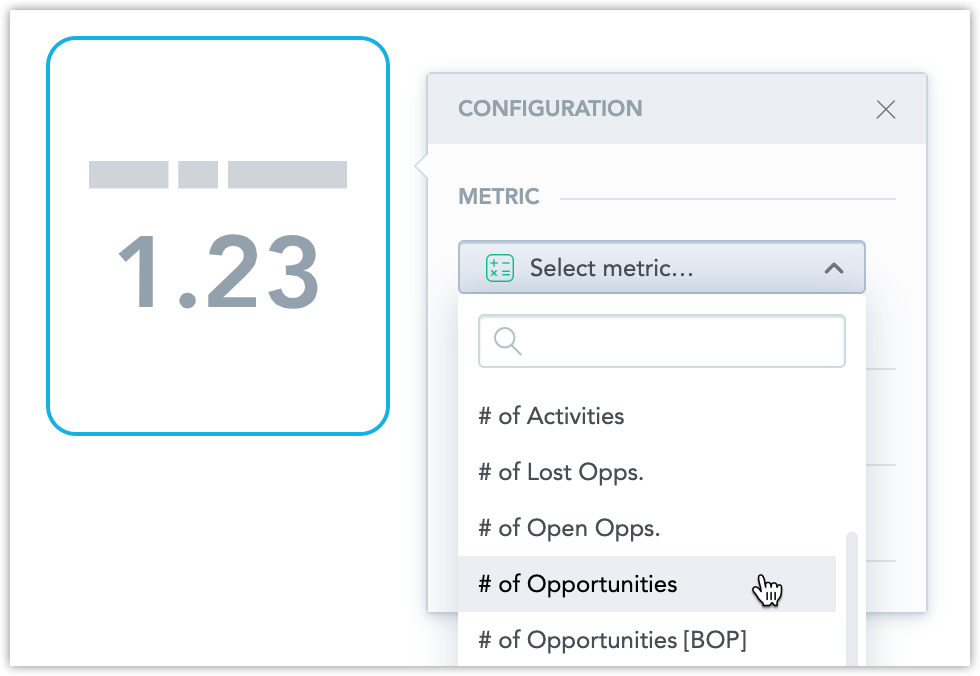
Select a metric to display.
Click the KPI to:
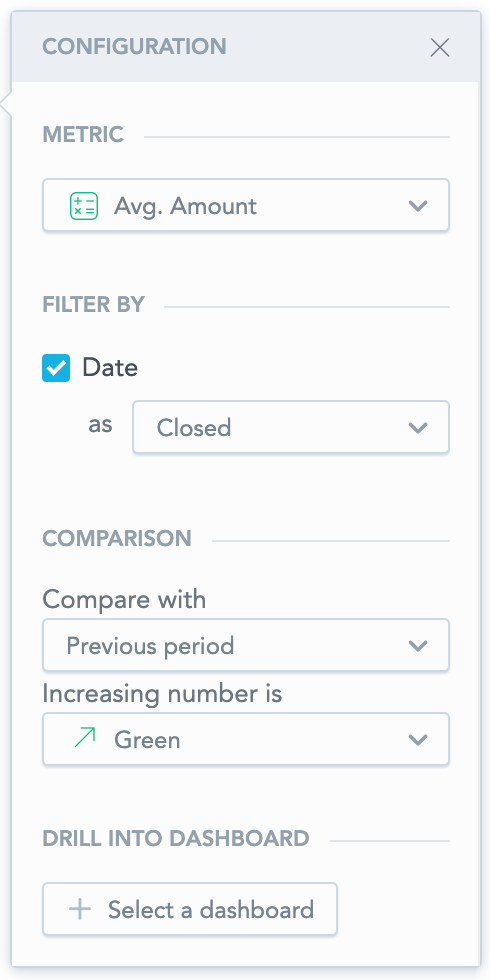
Filter by different attributes - select any option in the Filter by section. The availability of the options depends on the data available in your workspace.
Compare data with the previous period or the same period in previous year - select the option in the Comparison drop down. You can also select whether the resulting percentage is displayed in red or green.
Open a pixel-perfect dashboard when user clicks the KPI - select a dashboard in the Drill into dashboard .
To hide this option in the embedded mode, contact the GoodData Support.
Finish and save
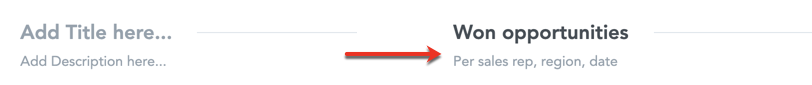
To add a title and/or description for a section on the dashboard, click Add Title here and Add Description here at the top of a section. The maximum length of the title is 50 characters; the maximum length of the description is 300 characters.
 To hide the title or the description in the View mode, leave it empty when editing the dashboard.
To add a name for the dashboard, click Untitled at the top and type the name. To change the dashboard name later, see Rename Dashboards.
Filter dashboards by date and attributes
For details, see Filters in Dashboards.
Add alerts to KPIs
For details, see Add an Alert to a KPI.
Share dashboards
Every dashboard that you create is saved as a private dashboard that only you can see. You can find your private dashboards in the Private section on the Dashboards tab.
For details about sharing dashboards with other users, see Share Dashboards.
Edit dashboards
To edit a dashboard, select it in the list of dashboards and click Edit.
For additional details, see these topics:
Duplicate dashboards
For details, see Duplicate Dashboards.
Delete dashboards
For details, see Delete Dashboards.
Embed dashboards
For details, see Embed Dashboards.
KPI Examples
Example 1
Create a KPI to display the number of opportunities created this month (September 2019 in this example), and compare it to the number of opportunities created last month (August 2019):
- Drag and drop a KPI to the dashboard.
- For the KPI, select the # of Opportunities metric.
- Filter by the Opportunities Created date.
- Select Compare with → Previous period.
- Set the date filter to This month.
Comparison is always performed for the complete previous period.
If you are viewing the Dashboard on October 21, 2019, the KPI value is calculated for October 2019 (from the 1st till 21st inclusive) and is compared to the value calculated for September 2019 (from the 1st till the 30th inclusive).
Example 2
Create a KPI to display the number of opportunities closed last quarter (July 1, 2019 - September 30, 2019), and compare it to the number of opportunities closed in the same quarter previous year (July 1, 2018 - September 30, 2018).
- Drag and drop a KPI to the dashboard.
- For the KPI, select # of Opportunities.
- Filter by the Opportunities Closed date.
- Select Compare with → Previous year.
- Set the date filter to Last quarter.
How the Dashboard Date Filter and Insight Date Filters Interact
When you add insights to the dashboards, they are filtered by the dashboard date filter. The insight may include their own date filters as well (see Create Insights).
To disable the insight filter, unselect the Filter by date option on the right side pane.
| Dashboard filter | Insight filter | What is used |
|---|---|---|
| ❌ | ❌ | No date filter |
| ❌ | ✅ | Insight date filter |
| ✅ | ❌ | Dashboard date filter |
| ✅ | ✅ | Dashboard date filter If the same date dimension is used in both filters. |
| ✅ | ✅ | Both dashboard and insight date filters (the AND operator) If different date dimensions are used. |