Data Catalog in Analytical Designer
Overview
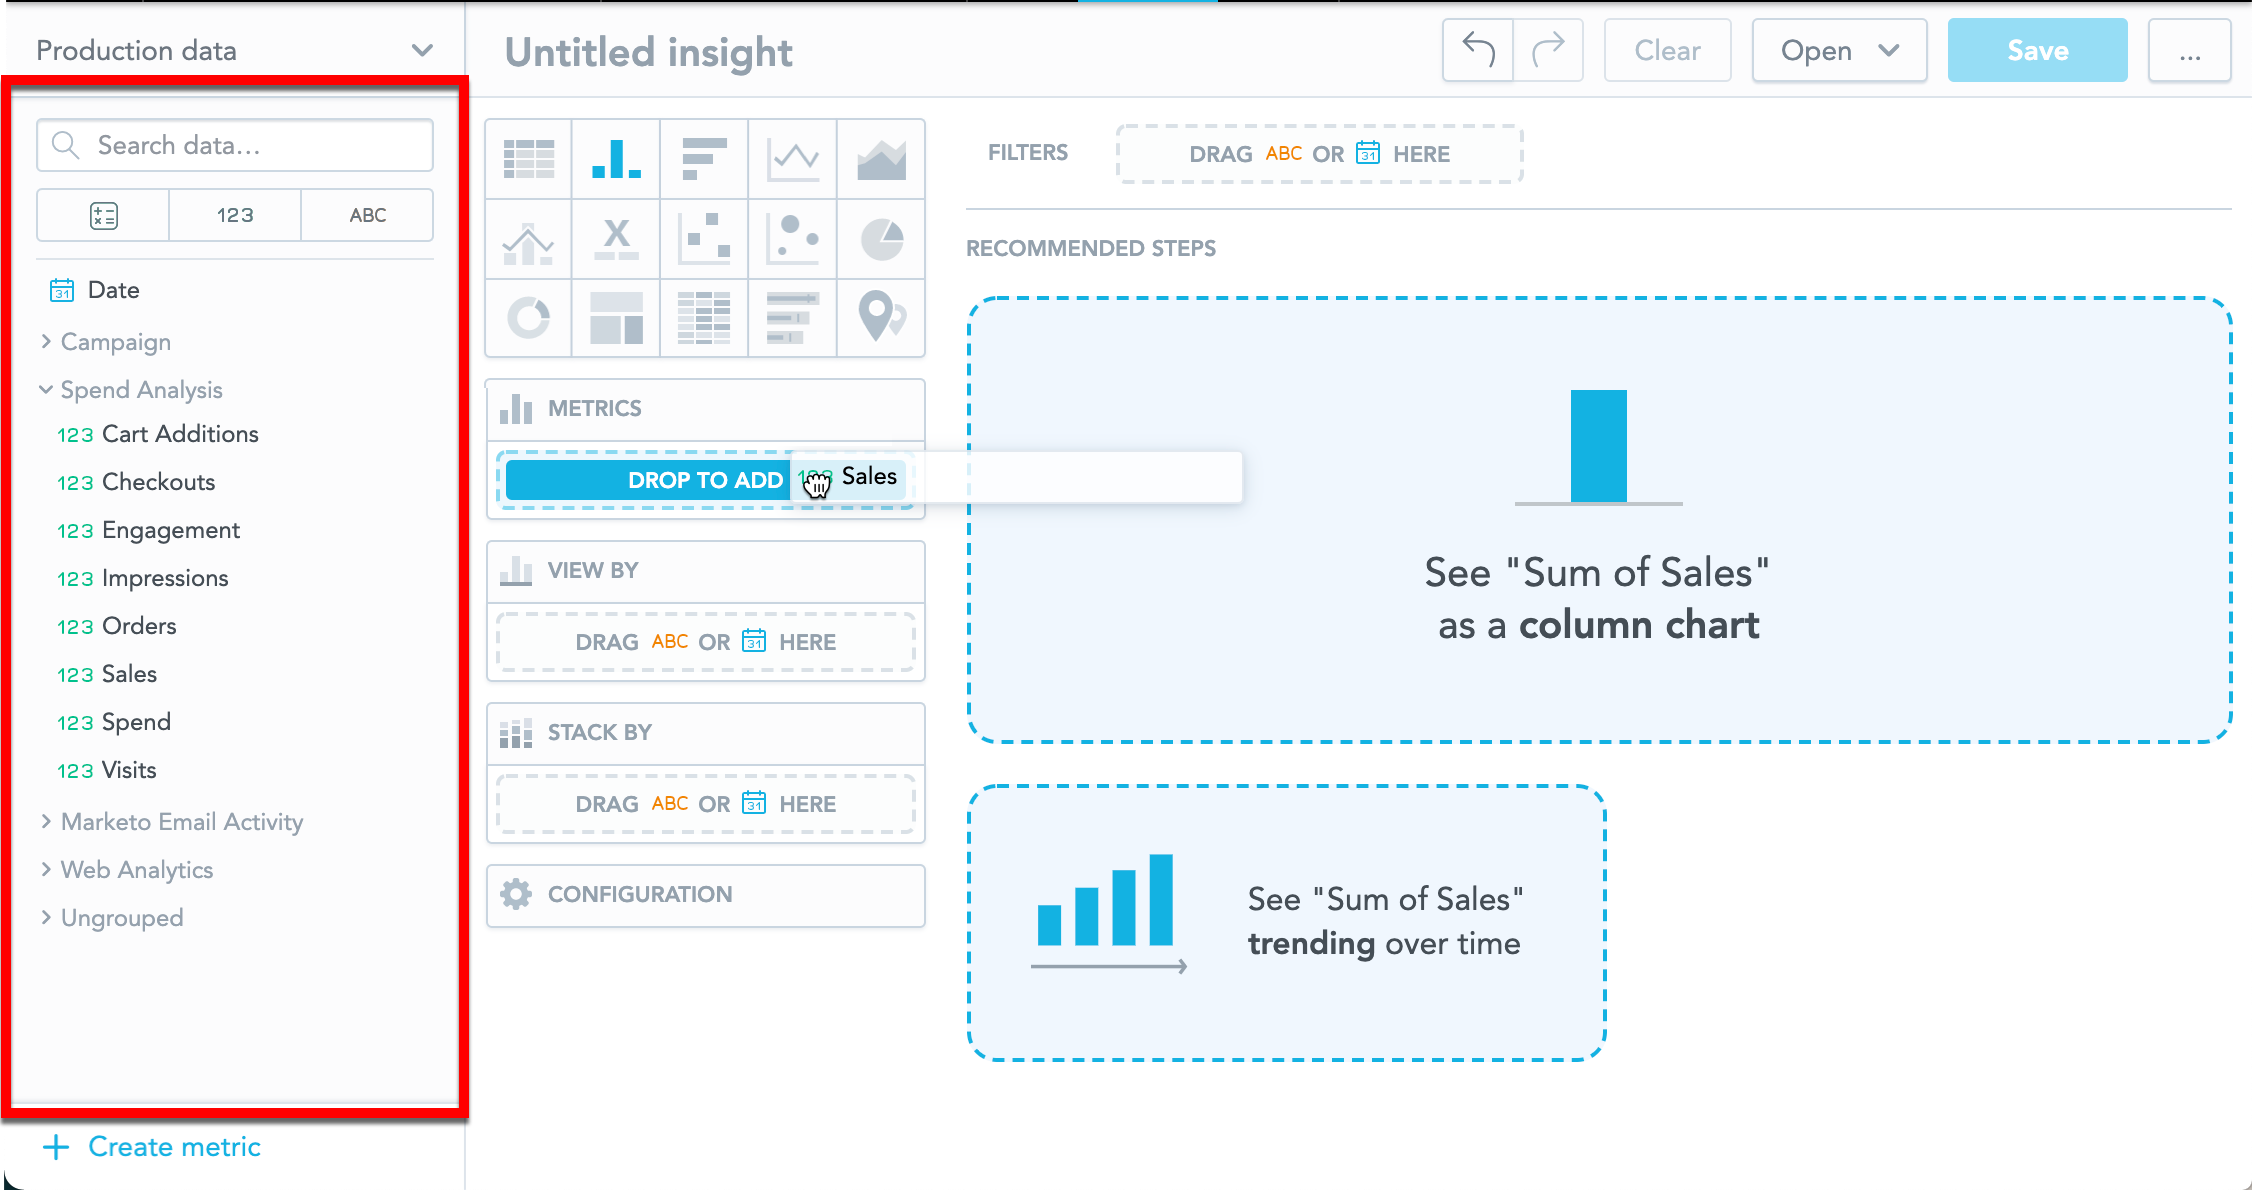
Data Catalog in Analytical Designer contains attributes, facts, and metrics that are available for your insights.
Data Catalog has three tabs that display one of each type - facts, metrics, or attributes.
To add items from the Data Catalog to your insight, drag and drop them into the appropriate section in the insight. For details about creating insights, see Create Insights.
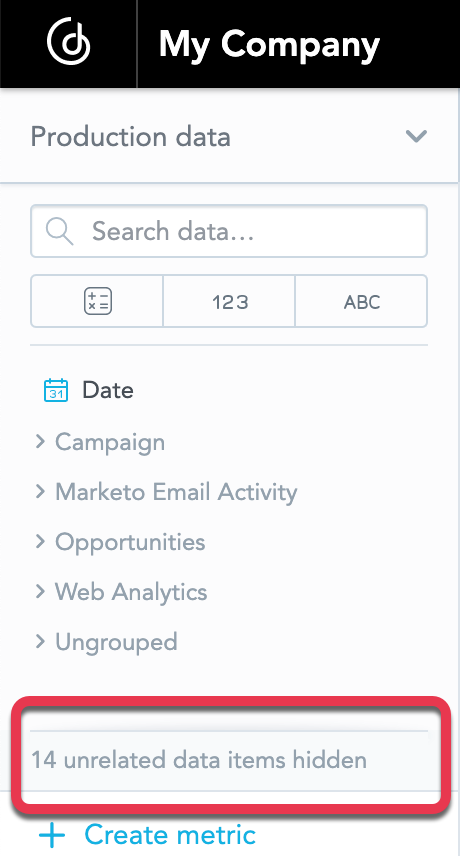
By default, the Data Catalog displays only items relevant to your insight. Items deemed inapplicable to your insight are hidden. This feature aims to protect users from creating malfunctioning insights.
However, advanced users might occasionally want to include certain hidden items.
Example: While GoodData may hide attributes that aren’t suitable for slicing, it doesn’t necessarily mean these attributes can’t be used for filtering. Hence, revealing and utilizing these hidden attributes might be appropriate in specific scenarios.
You first need to enable this feature by enabling the enableUnavailableItemsVisible feature flag. We recommend doing so at user level, to ensure only users who understand the associated risks have the ability to do this.
Using Hidden Items in Insights
If you use hidden items, it’s very easy to generate an insight that doesn’t return the data you expect.
Example: If you reveal a hidden item and use a previously concealed attribute as a filter, the filter might not be applied—or it might be applied incorrectly—especially if it’s incompatible with the data relationships.
Search for items
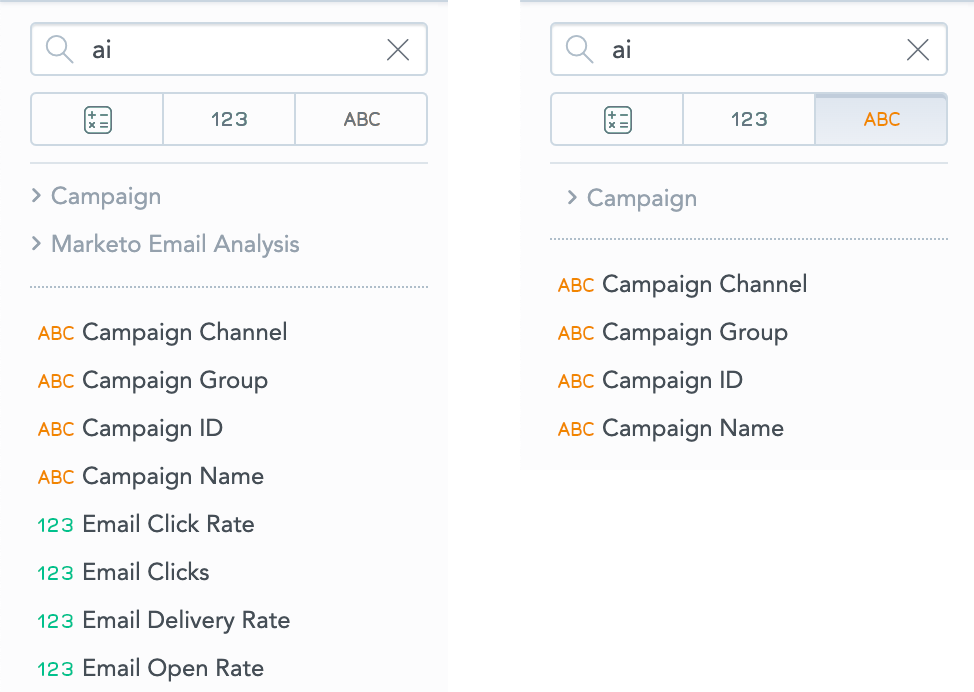
You can use the search bar in the Data Catalog to search for facts, metrics, and attributes you need.
Analytical Designer scans all item names and displays any item that contains your search string.
If you organize your catalog, Analytical Designer scans also the group names. For details, see Organize Data Catalog.
When you switch to another tab, the search results adjust to correspond with the items to be displayed in that tab.
Refresh Data Catalog
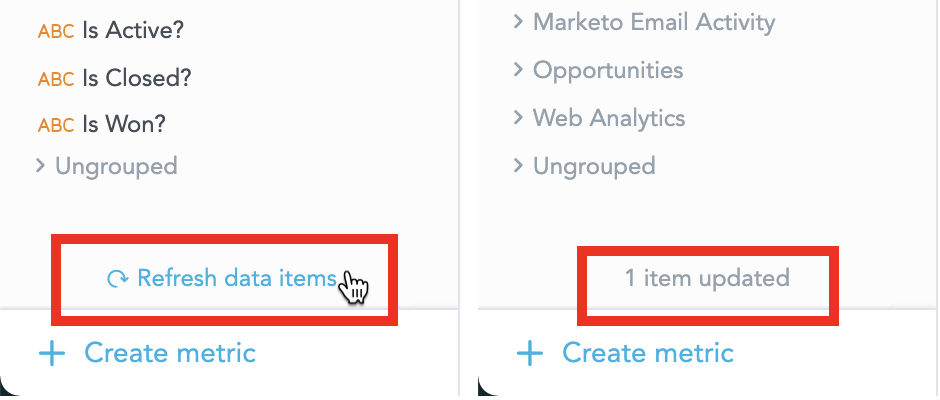
To refresh the data in your Data Catalog, hover your mouse over the catalog to display the refresh button and click the button.
Analytical Designer retrieves all changes, displays the number of items changed and also refreshes the insight to reflect the changes.
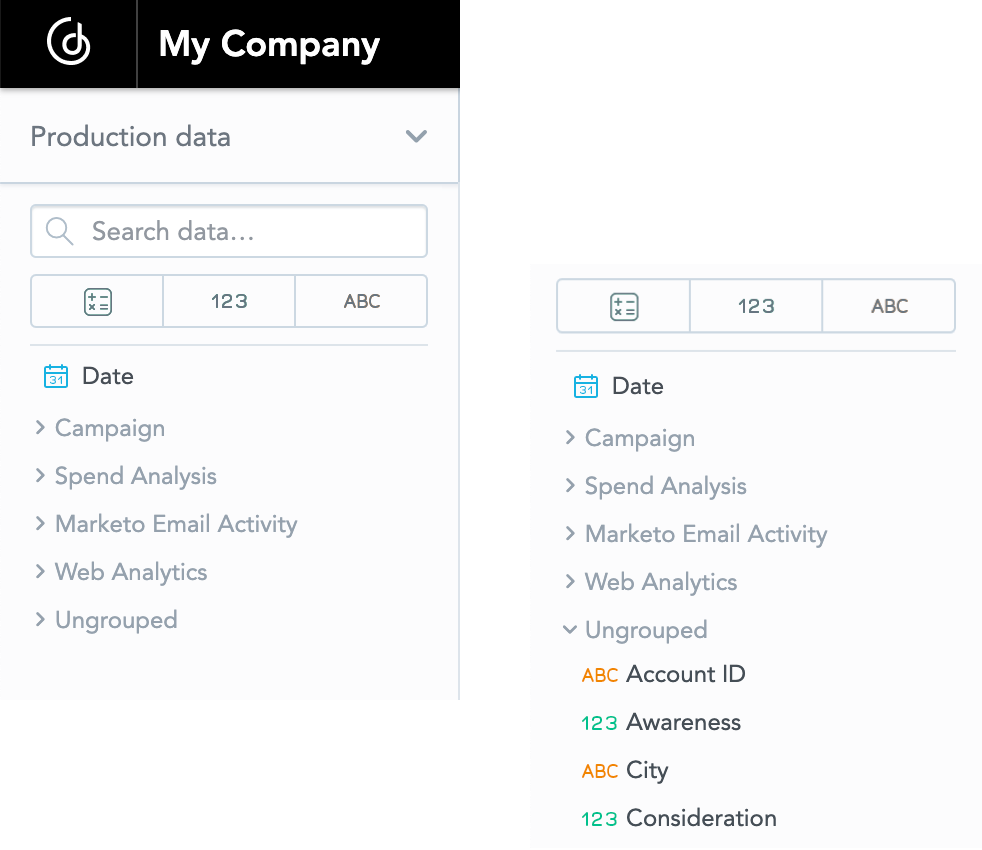
Organize Data Catalog
All facts, metrics, and attributes in Data Catalog are sorted alphabetically in a single list.
To help users find related items and group these visually, administrators can use the ADCatalogGrouping platform setting. For details, see Configure Various Features via Platform Settings.
By default, the ADCatalogGrouping is set to Disabled .
To group facts, metrics, and attributes, you have the following two options:
- Group using folders The platform setting value is
ByFolders. - Group using tags The platform setting value is
ByTagNamingConvention.
Both options are visually the same. For differences, see the sections below.
Groups and items within the groups are sorted alphabetically.
Items that do not belong to any group are displayed in Ungrouped. Ungrouped is always the last group in the list.
For details about editing platform settings, see Configure Various Features via Platform Settings.
Group by folders
Use folders if you want to localize their names in Analytical Designer. Folder names can contain special characters and capital letters, however, one item can belong only to a single folder/group.
To group by folders, set the ADCatalogGrouping platform setting to ByFolders. For details, see Configure Various Features via Platform Settings.
For details about localization, see Metadata Localization.
Group by tags
Use tags if you want to add an item to multiple groups and do not need localization.
You can add tags in the Manage section in GoodData Portal. For details, see Add a Tag to a Fact, Add a Tag to a Metric, and Add a Tag to an Attribute.
Tags can contain only lowercase letters and no white spaces. To display user-friendly group names, GoodData offers a parsing mechanism as follows:
- The tags must start with
adgroup_ - The
_(underscore) character is replaced by a white space - Each letter after
_(underscore) is capitalizedadgroup_web_analytics= Web Analytics - To capitalize a letter inside a word, use
^(circumflex accent)adgroup_campaign^a_donations= CampaignA Donations - To start a word with a lowercase letter, add
__(two underscores) before the wordadgroup_spend__analysis= Spend analysis
To group by tags, set the ADCatalogGrouping platform setting to ByTagNamingConvention. For details, see Configure Various Features via Platform Settings.
Default folder state
By default, all folders in your Data Catalog are collapsed. If you want to have all items within the groups visible whenever you access Analytical Designer, set the ADCatalogGroupsExpanded platform setting to true.
For details, see Configure Various Features via Platform Settings.
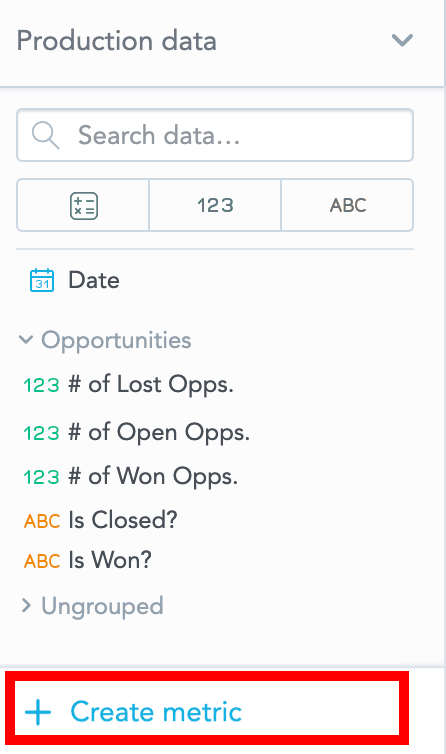
Add items to Data Catalog
You can add new items by:
- Uploading a CSV file with your data to add new items to your Data Catalog. For details, see Load CSV Files to Your Workspace.
- Clicking Create metric at the bottom of the catalog to use an editor. For details, see Create and Save a Metric.
Additional information
For other details, see the Analytical Designer - Frequently Asked Questions.