Create Metrics in Insights
In Analytical Designer, you can create your own metrics from the facts and metrics already available in your insights using basic arithmetic functions.
Overview
You can create new metrics from:
- Facts, metrics, and attributes that you add to the Metrics section from the Data Catalog.
- Derived metrics created using the time over time comparison. For details, see Time over Time Comparison.
- Already created metrics.
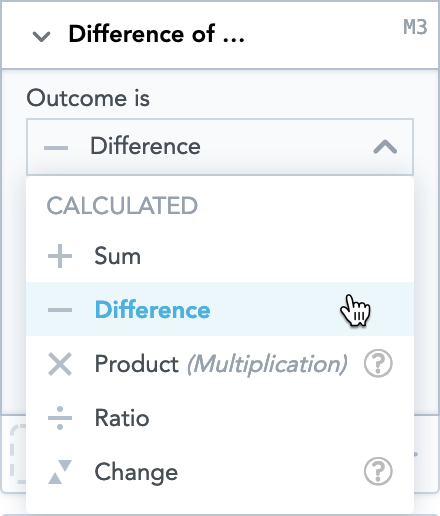
The following table lists all available functions:
| Function | Expression | Example | Default format |
|---|---|---|---|
| Sum | A+B | Sum of A and B | ##.## |
| Difference | A-B | Difference of A and B | ##.## |
| Product (Multiplication) | A×B | Product of A and B | ##.## |
| Ratio | A÷B | Ratio of A and B | ##.## |
| Change | (A-B)÷B | Change from B to A | ##.##% |
Created metrics depend on the items that are used to create them. If you delete an item used to create the metric, Analytical Designer deletes the created metric as well. Also, if you switch to an insight type that cannot display items used to create the metric, this metric is hidden.
Created metrics are available only in the insights where you create them - Analytical Designer does not save these metrics to the Data Catalog. To use them elsewhere, create the metric again in another insight.
To create complex metrics, click the Create metric in the left bottom corner to open Metric Editor. For details, see Get Started with Using MAQL to Write Metrics.
Naming created metrics
Analytical Designer creates an automatic name for the created metrics. The name consists of the name of the function and metrics used. For example, Difference of Emails Sent and Emails Delivered. For details about changing the name, see Rename Metrics.
Comparing created metrics over time
You can compare created metrics over time as any regular metric. For details, see Time over Time Comparison.
Metrics created from metrics already derived from time over time comparison cannot be compared over time again.
Create metrics using arithmetic functions
- In Analytical Designer, create an insight with at least two items in the Metrics section.
- In the Metrics section, hover your mouse over the plus sign and click Create metric.
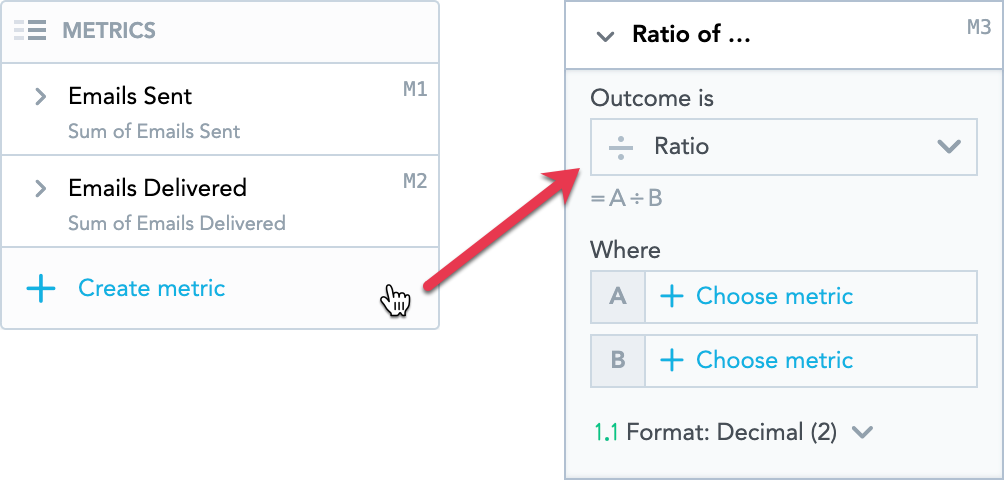
- In the Outcome is dropdown menu, select the function that you want to use to calculate the new metric.
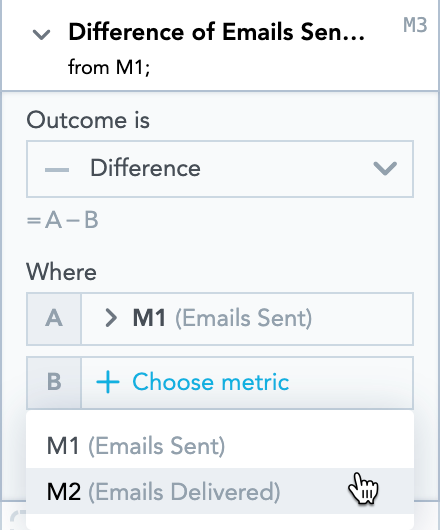
- In the Where section, click Choose metric and select an item from the list of available items for both parts of the function (A and B). The items you select are highlighted above in the Metrics section.
Analytical Designer adds a new metric to the Metrics section and displays it in the insight.
For a sample insight with created metric, see the Example below.
Deleting created metrics
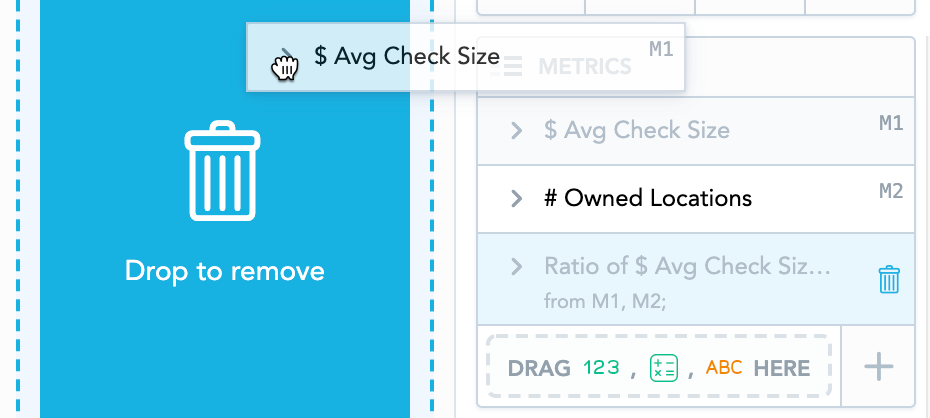
To delete created metrics, drag and drop them to the Data Catalog.
If you remove any item that is part of the created metric, this metric and metrics derived from it are also removed.
When you drag this metric to the Data Catalog, Analytical Designer highlights all the items to be deleted and then displays a message.

Example
You send regular emails to your customers. You want to know how many of these emails are not delivered to the customers' inboxes each year.
Your Data Catalog includes the following data:
- The number of emails you sent to your customers (Emails Sent)
- The number of emails that were actually delivered (Emails Delivered)
You can use these two metrics to calculate the number of emails that customers did not receive.
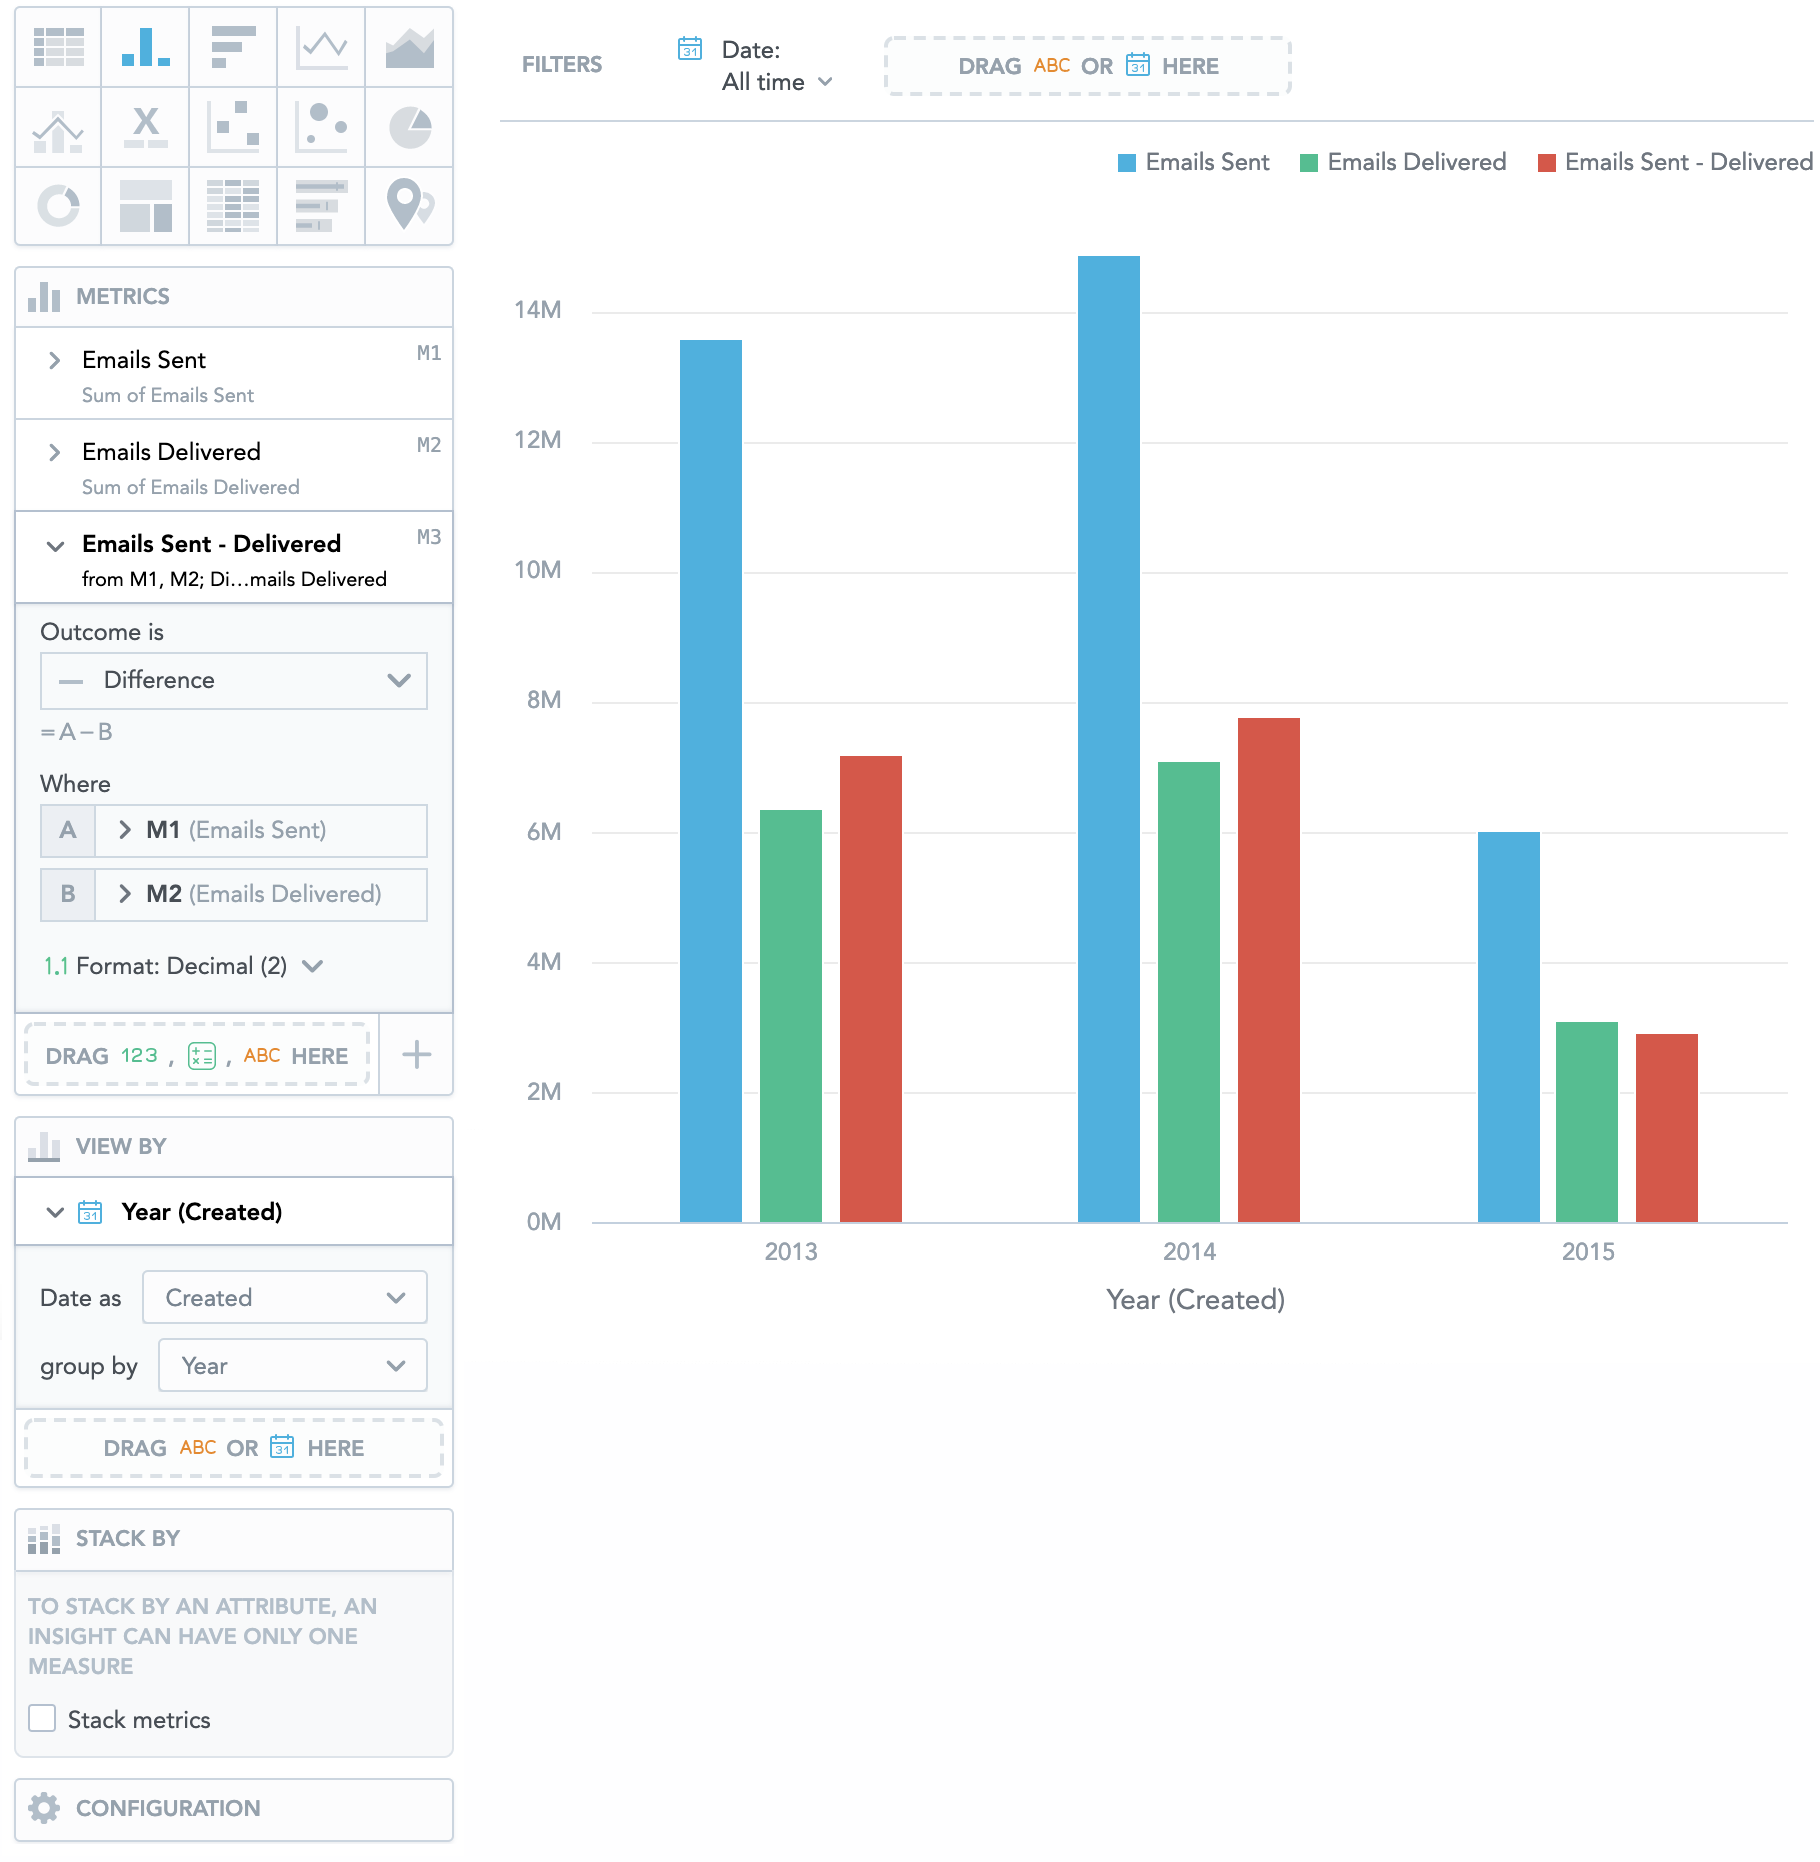
- Drag Emails Sent and Emails Delivered to the Metrics section.
- Add Date to the View by section and group by Year.
- Click Create metric and select:
- Difference as the Outcome
- Emails Sent as M1
- Emails Delivered as M2.
The image below shows the final insight.