Funnel Charts
This visualization is currently an opt-in feature. To enable this feature, follow the Configure Various Features via Platform Settings article. Note that if you are using GoodData.UI for custom apps and plugins, this feature is not going to be supported until GoodData.UI version 9 becomes available.
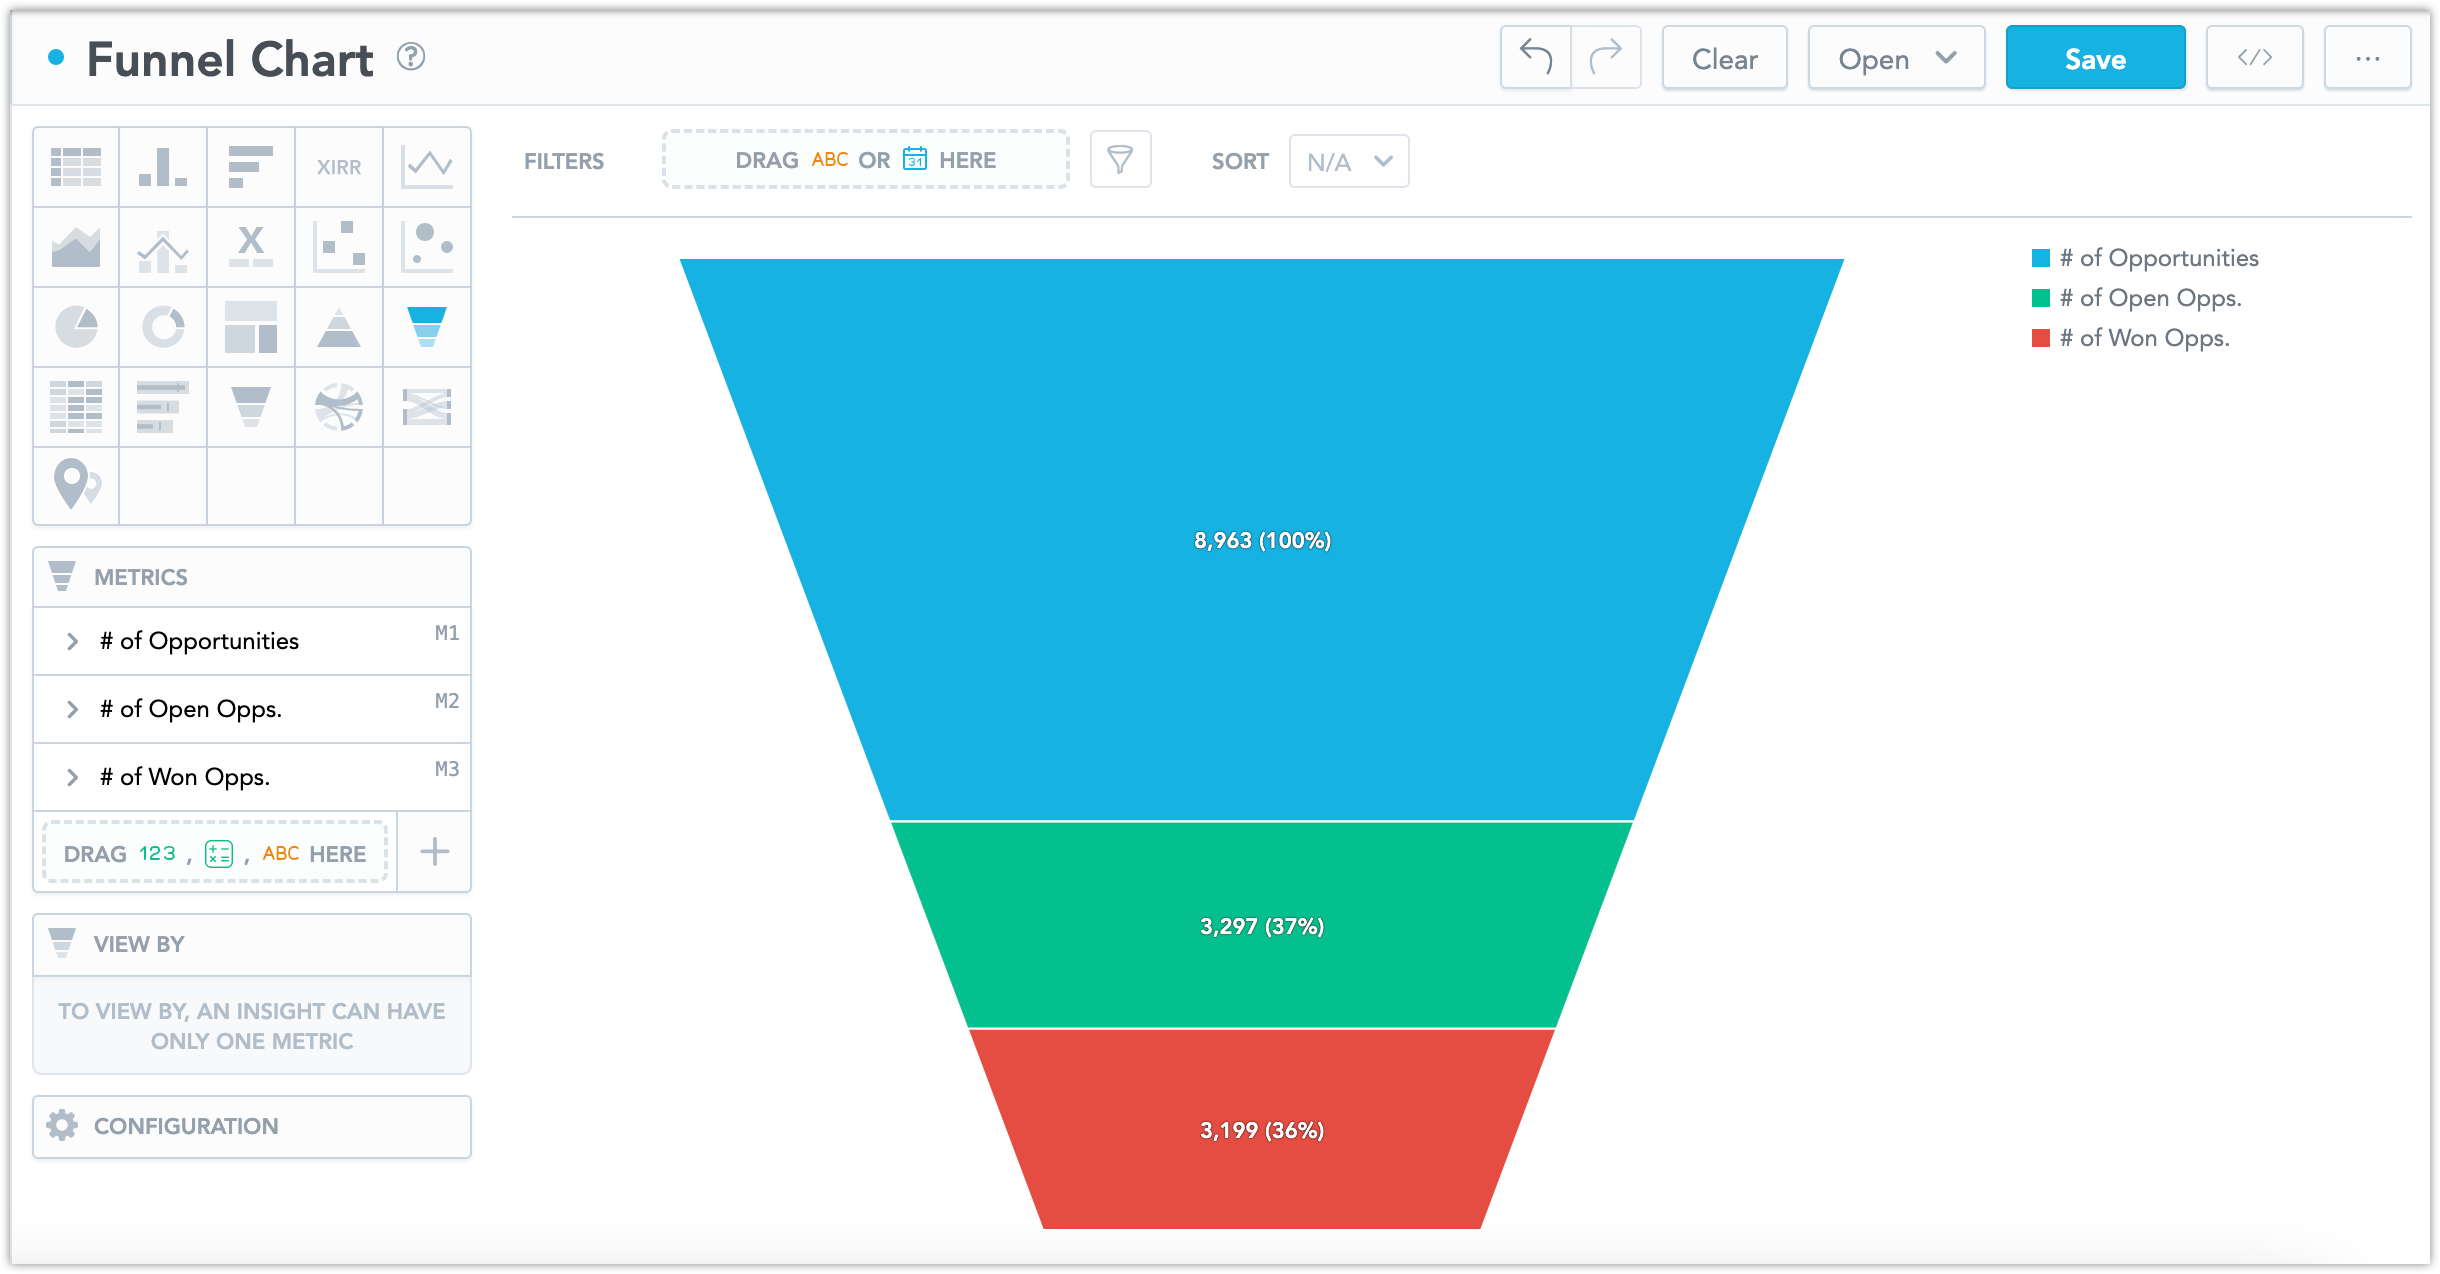
Funnel charts are great at showing the progressive stages of a process or workflow. They are mostly used for displaying customer journeys or conversion funnels. Because they can effectively demonstrate the drop-offs at each stage of the process, they can help identify bottlenecks or optimize conversion rates.
Funnel Charts have the following sections:
- Metrics
- View By
- Configuration
By default, the values are shown as a percentage of the first stage. If you want to see only the numeric values, uncheck the Percentage checkbox in the Configuration section.
For information about common characteristics and settings of all visualizations, see the Visualization Types section.