You are viewing our older product's guide. Click here for the documentation of GoodData Cloud, our latest and most advanced product.
Bullet Charts
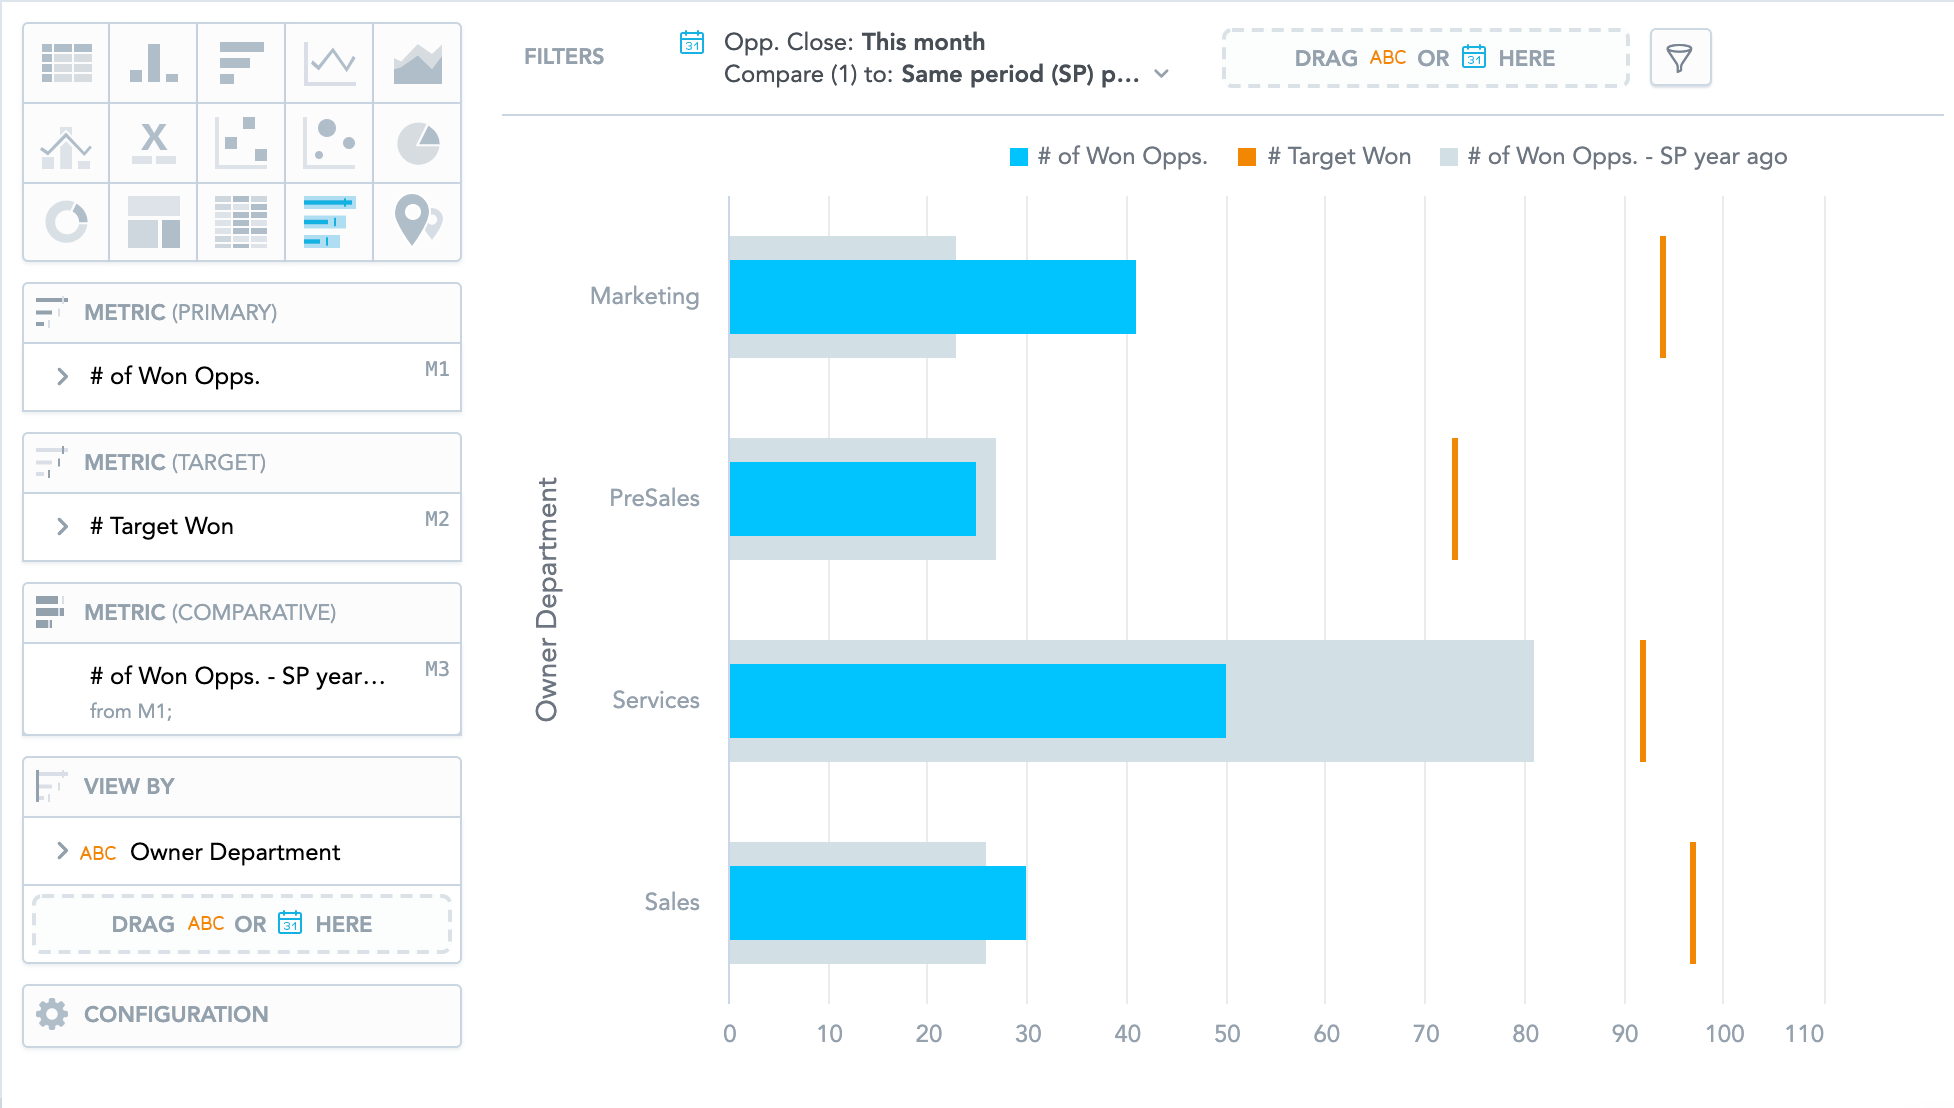
Bullet charts display performance of metrics and progress towards a goal specified by another metric.
Bullet charts have the following sections: Metric (Primary), Metric (Target), Metric (Comparative), View by, and Configuration.
In bullet charts, you can also:
- Compare your data to previous period or same period of the previous year. For details, see Time over Time Comparison.
- Slice your data by up to two dates or attributes. Add the dates or attributes to the View by section.
- If you add two dates in the View by section, they must have the same date dimension (the Date as option) - if you change the date dimension of one date attribute, Analytical Designer changes the date dimension of the second date attribute automatically. The Group by option can have different values.