You are viewing our older product's guide. Click here for the documentation of GoodData Cloud, our latest and most advanced product.
Report Editorの円グラフ
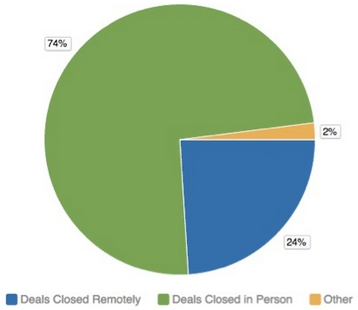
円グラフを使用すると、ビューアで全体のコンポーネント部分を視覚化できます。

レポートを円グラフとして表示するには、Report Editorでグラフアイコンのリストから円グラフを選択します。
Report Editorの詳細については、Report Editorでレポートを新規作成するを参照してください。
