Handle Drilling Report Requests through Your Web Application
For embedded GoodData dashboards and reports
You can set up the GoodData platform so that you can manage users’ requests to drill into reports yourself instead of relying on the platform.
This means, when a user clicks a value within an embedded report, or in a report in the embedded dashboard, your web application catches the drilling request, analyzes it, and sends back the drilling data from your system.
By default, all drilling report requests are handled through the GoodData platform. That is, when a user clicks a value within an embedded report, or in a report in the embedded dashboard, the linked report is displayed with data filtered by the selection in the original report (for more information, see Drilling into Reports). You can change this behavior to make your system handle a report drill event. When a user clicks a drillable value within an embedded report, or in a report in the embedded dashboard, the linked report is not displayed. Your system is responsible for catching the event and showing the drill data based on your own data.
In GoodData, terms workspace and project denote the same entity. For example, project ID is exactly the same as workspace ID.
Prerequisites
Before you start, verify that the following requirements are met:
- Your application is white labeled White Label Your Domain.
- Your application can communicate with the GoodData platform via CORS. To allow a communication between your application and the GoodData platform, contact GoodData Customer Support and provide your application URL, from which the ui.drill event will be handled.
Steps:
Add the event override parameter to your URL:
https://your.whitelabeled.gooddata.com/dashboard.html#project={Project_URL}&dashboard={Dashboard_URL}&tab={Tab_ID}?override=ui.drillYour system is now configured to initiate a report drill event instead of displaying the drill target within the GoodData user interface. The GoodData platform will not show the linked report to users. Your system is responsible for catching the event and showing the relevant content to the users. Note that the ui.drill parameter will override the default behavior for all reports in the embedded dashboard.
Update your parent application so it catches, handles, and processes drilling requests. The process of updating the code depends on what application you use.
For more information about the ui.drill event and other events and methods, see Embedded Dashboard and Report API - Events and Methods.
How to Interpret the ui.drill Structure
A ui.drill event always contains execution context parameters:
 {
   gdc: {
      name: 'ui.drill',
      type: 'app.event',
      data: {
         executionContext: {...serializedExecutionContext},
         reportUri: URISTRING
      }
   }
}
You should be able to understand what these parameters represent and configure your system to handle them correctly.
Imagine that you have a report that shows the number of tickets created per month. In this report, the metric is the number of tickets. The attribute is the month of the year.
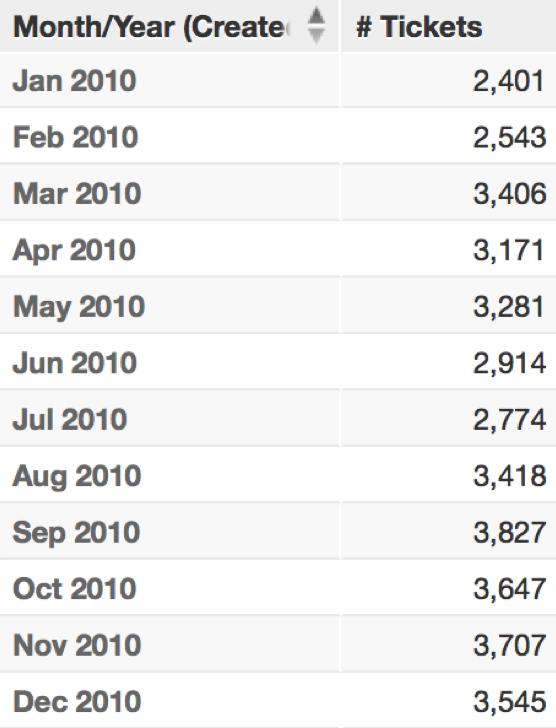
You configure how to drill in this report: when you click the number of tickets created within a particular month, it will show you how the tickets are distributed within this month; how many tickets were created on each date within the month.
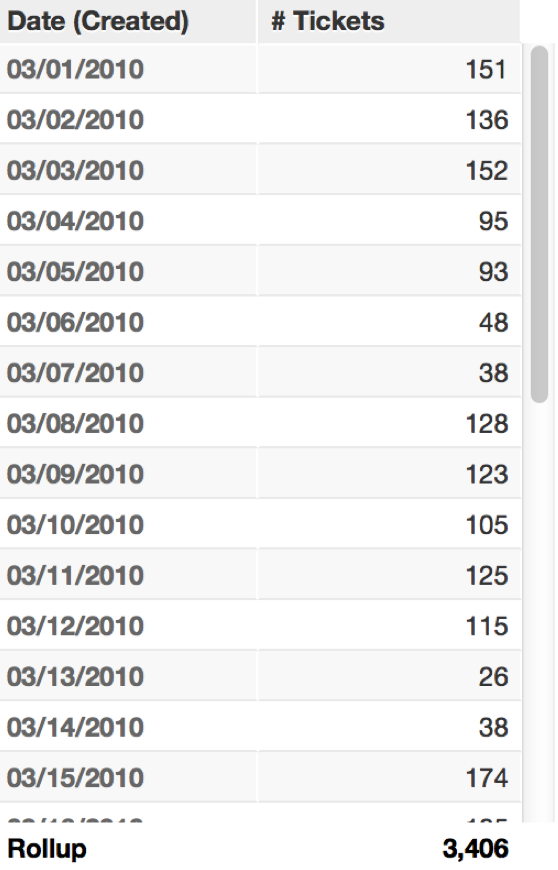
For example, click the number of tickets for March 2010 (that is, 3.406) to get it sliced by dates within this month:
Then, you enable the ui.drill event on your system. From now on, when you drill into the report (that is, click the number of tickets for a particular month), the system will return you the following execution context object within the ui.drill event data:
...
"executionContext": {
   "drillInto": {
      "locators":[
         {
            "attributeLocator2": {
               "uri": "/gdc/md/demoProject/obj/2222",
               "element":"/gdc/md/demoProject/obj/3333/elements?id=44"
            }
         },
         {
            "metricLocator": {
               "uri": "/gdc/md/demoProject/obj/5555"
            }
         }
      ],
      "target": "/gdc/md/demoProject/obj/1111",
      "targetType":"attributeDisplayForm"
   }
}
...
In this example:
attributelocator2identifies what you clicked to drill in:uriis the URI of the attribute by which the metric is sliced (that is,Month/Year (Created)).elementis the URI of the attribute value (that is, March 2010).
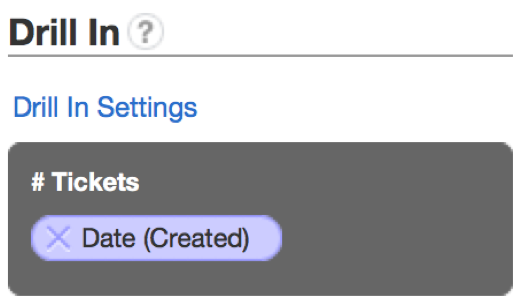
metricLocatorspecifies the URI of the metric (that is, the number of tickets).targetspecifies the URI of the value (with theattributeDisplayFormtarget type) by which the clicked value is drilled in (that is,Date(Created)).
Now, let’s take a look at another example where you drill into a report on a dashboard with some filters applied. Here is the excerpt from the ui.drill event data:
{
    "data": {
        "executionContext": {
            "drillInto": {
                "locators": [
                    {
                        "attributeLocator2": {
                            "element": "/gdc/md/demoProject/obj/163/elements?id=8032",
                            "uri": "/gdc/md/demoProject/obj/164"
                        }
                    },
                    {
                        "attributeLocator2": {
                            "element": "/gdc/md/demoProject/obj/97/elements?id=39416",
                            "uri": "/gdc/md/demoProject/obj/102"
                        }
                    },
                    {
                        "metricLocator": {
                            "uri": "/gdc/md/demoProject/obj/344"
                        }
                    }
                ],
                "target": "/gdc/md/demoProject/obj/247",
                "targetType": "attributeDisplayForm"
            },
            "filters": [
                {
                    "constraint": {
                        "from": "2006-07-01",
                        "to": "2008-03-31",
                        "type": "interval"
                    },
                    "uri": "/gdc/md/demoProject/obj/100"
                },
                {
                    "constraint": {
                        "elements": [
                            "/gdc/md/demoProject/obj/240/elements?id=107",
                            "/gdc/md/demoProject/obj/240/elements?id=11"
                        ],
                        "type": "list"
                    },
                    "uri": "/gdc/md/demoProject/obj/241"
                }
            ]
        },
        "reportUri": "/gdc/md/demoProject/obj/489"
    },
}
Note that this time the executionContext section contains two subsections:
- The
drillIntosection describes the information about what value you drilled into and by what target value it was broken down. In the previous example, we explained the parameters that this subsection holds. - The
filterssubsection describes the filters applied to the dashboard. Filters are defined by theconstraintparameter.
In our example, two filters are applied:
- The date filter, which is identified by the
intervaltype. This filter limits the displayed values to the period from July 1, 2006, till March 31, 2008. - The attribute filter, which is identified by the
listtype. This filter limits the displayed attributes to the attributes with IDs 107 and 11.
In other cases, you can also see floating filters. The floating filters are identified by the floating type, and they filter date-related attribute values relative to the present. In floating filters, the from and to parameters define a relative shift from today with respect to the date granularity attribute that is defined by the uri parameter.
Also, note the reportUri parameter at the bottom of the example. This parameter is the URI of the report definition, which identifies the report where you clicked the value to drill into.
For more information about the ui.drill event and other events and methods, see Embedded Dashboard and Report API - Events and Methods.