Filter an Embedded Dashboard with a URL Parameter
You embed dashboards in other web applications using the iframe URL. You can add a parameter to the URL and embed a dashboard to display only a subset of the information the dashboard shows. Thus, you can provide some users with a simplified version of an otherwise complex dashboard.
If you are looking for information about how to filter an embedded report, see Filter an Embedded Report with a URL Parameter.
For example, you have a dashboard that shows information about all the groups in your organization, and you want to make the dashboard available through another application with only a subset of groups displayed.
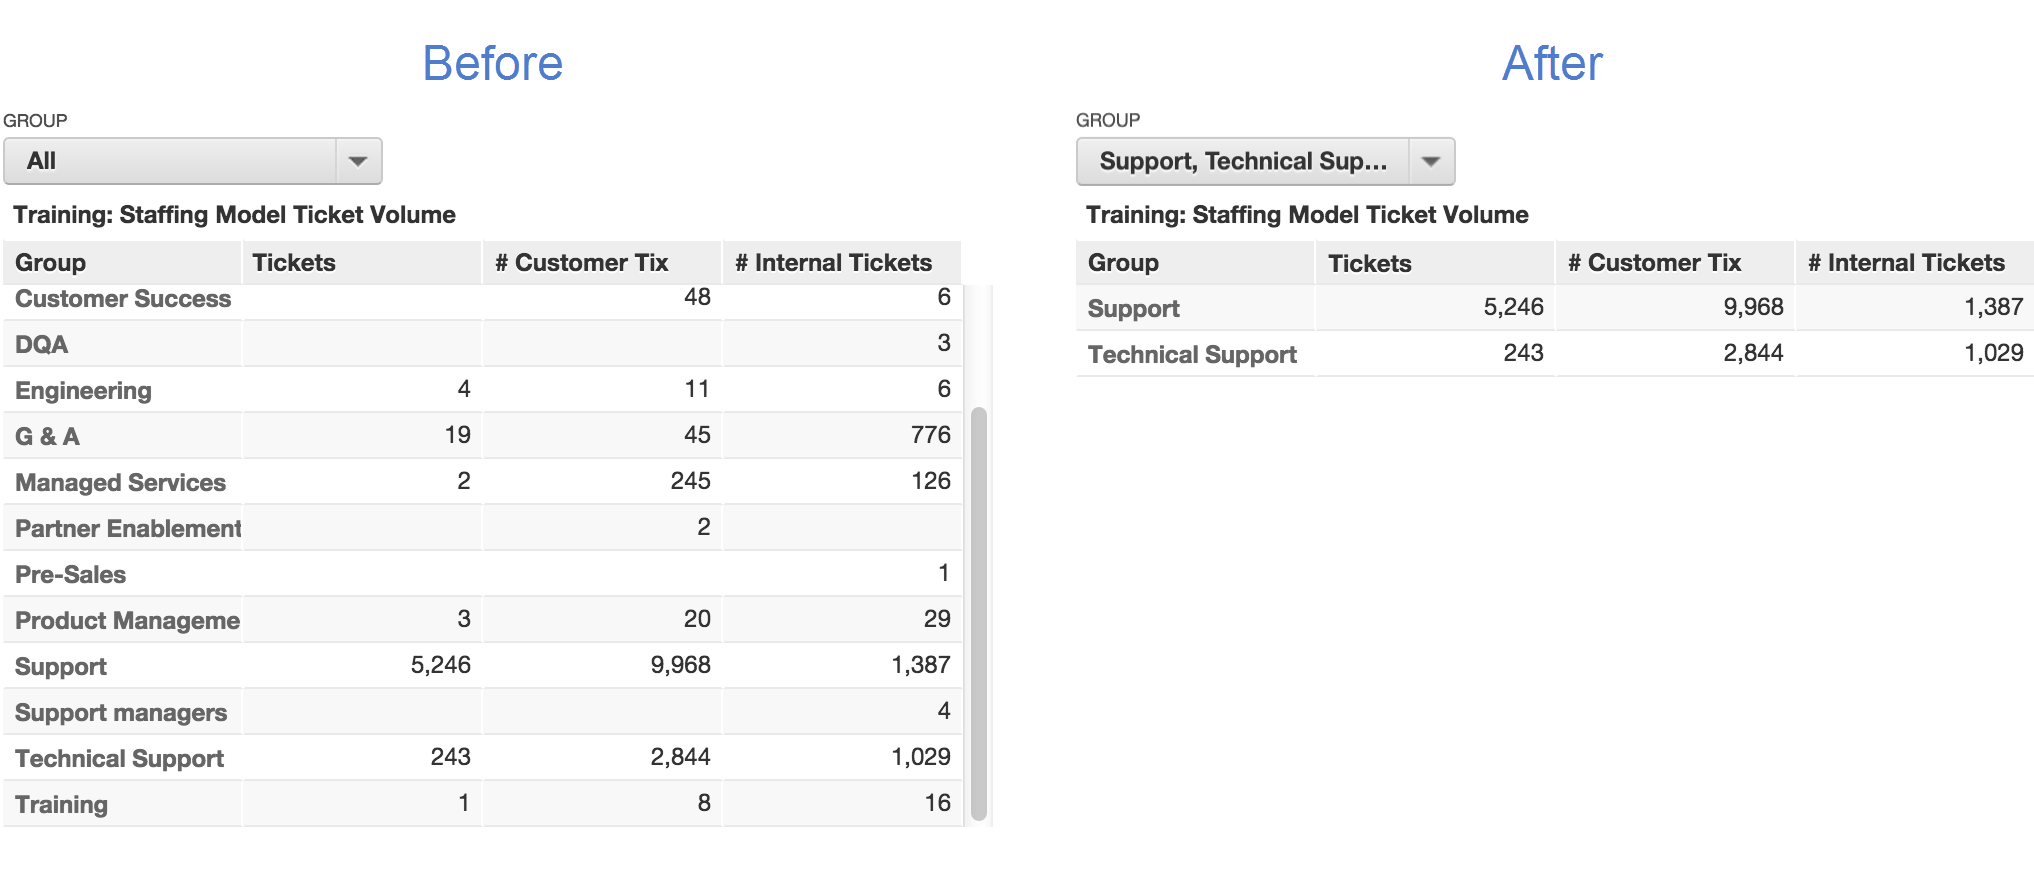
In the picture above, the filter with a URL parameter limits the information that appears in an embedded dashboard, but it does not remove any attribute values from the Group dashboard filter’s drop-down list. All the groups continue to appear in the Group filter.
For filtering an embedded dashboard, you can use any attribute that is compatible with your workspace logical data model and not just those attributes that are used as dashboard filters.
Limitations
When filtering a dashboard with a URL parameter, consider the following:
- Adding a URL parameter to the URL of the dashboard increases the number of characters in the URL. Some browsers may limit the total length of the URL. We recommend that you keep the URL below 2000 characters.
- The filtering applies to all the reports on the dashboard. You cannot dissociate it from certain reports as you would do with dashboards filters (see Dissociate Dashboard Filters from a Report).
- Due to performance considerations, this method is only usable for attributes with at most 1000 distinct values. If an attribute has more than 1000 distinct values, some values might not get selected in the filter.
- If the dashboard includes the same filter and users select other values for filtering directly on the dashboard, the report shows the newly selected values regardless of the URL parameter.
For a more powerful and flexible way of adding filters, try the embedded dashboard method of applying attribute and date filters to an embedded dashboard (see “Apply attribute and date filters to a dashboard” in Embedded Dashboard Methods).
Filter a Dashboard with a URL Parameter
In this example, you are using another dashboard tab in your workspace as the target embedded dashboard, instead of embedding it in an outside application. However, the technique to apply this procedure to an outside application is very similar. This procedure alternates between two dashboards - source and target. It may be helpful to have both dashboards open in a single browser and to use a text editor for staging the code that you copy and paste.
In GoodData, terms workspace and project denote the same entity. For example, project ID is exactly the same as workspace ID. See Find the Workspace ID.
Steps:
Open both dashboards in a single browser (recommended).
In the source dashboard, open the desired tab.
Copy the tab’s object identifier value (a424c3eaf1df in this example). From the end of the URL, copy the string of text following the vertical bar (
|). Paste it in the text editor for use later in this procedure.https://secure.gooddata.com/#s=/gdc/projects/8thc020r46ru5mej90dewtxsdmfdmn9w|projectDashboardPage|/gdc/md/8thc020r46ru5mej90dewtxsdmfdmn9w/obj/1018371|a424c3eaf1dfIn the source dashboard, click the Gear icon, and then click Embed.
Expand the Set URL Parameter Filters section, click select attribute…, and then select the attribute that you want to filter (Group, in this example).
In the Attribute Wild Card field, enter the attribute values that you want the dashboard to display (Support and Technical Support, in this example). Separate multiple values with commas and no spaces. Multiple attribute values within the same filter are joined using the
ORorANDlogical operators. When the attribute name/value pair has been populated, the code snippet is automatically updated.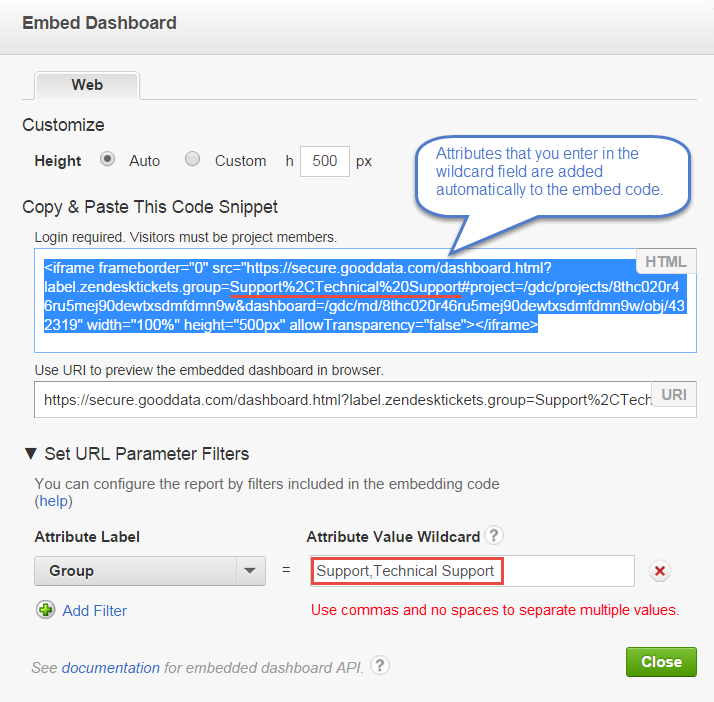
Copy the HTML code and paste it into a text editor for use later.
Click Close.
Open the target dashboard, click the Gear icon, click Edit, and then click Web Content.
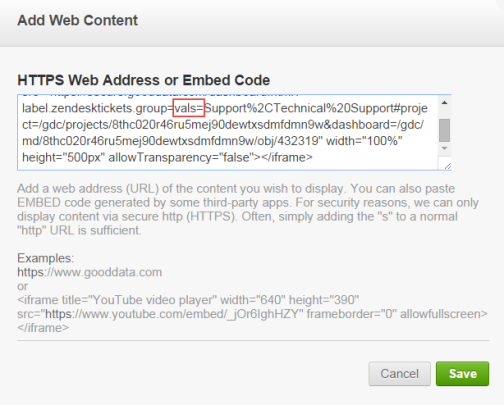
In the Add Web Content dialog box, paste the HTML code that you copied from the source dashboard.
If you enter multiple attribute values in the wildcard field in step 6, add vals= immediately to the left of the attribute value, as shown in the below:
Click Save.
Drag the dashboard to the desired location.
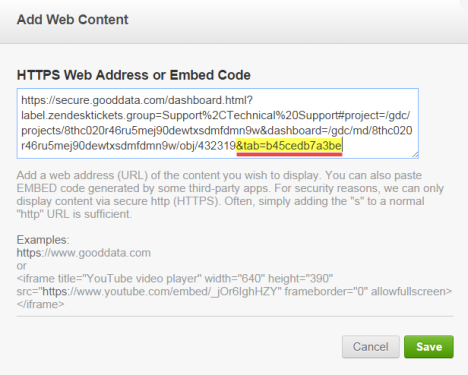
If the dashboard has multiple tabs:
- With the dashboard selected, click the Link icon.

- At end of the web address, enter &tab= followed by the tab’s object identifier that you copied from the source dashboard. For more information, see Configure an Embedded Dashboard to Display a Specific Tab.
- With the dashboard selected, click the Link icon.
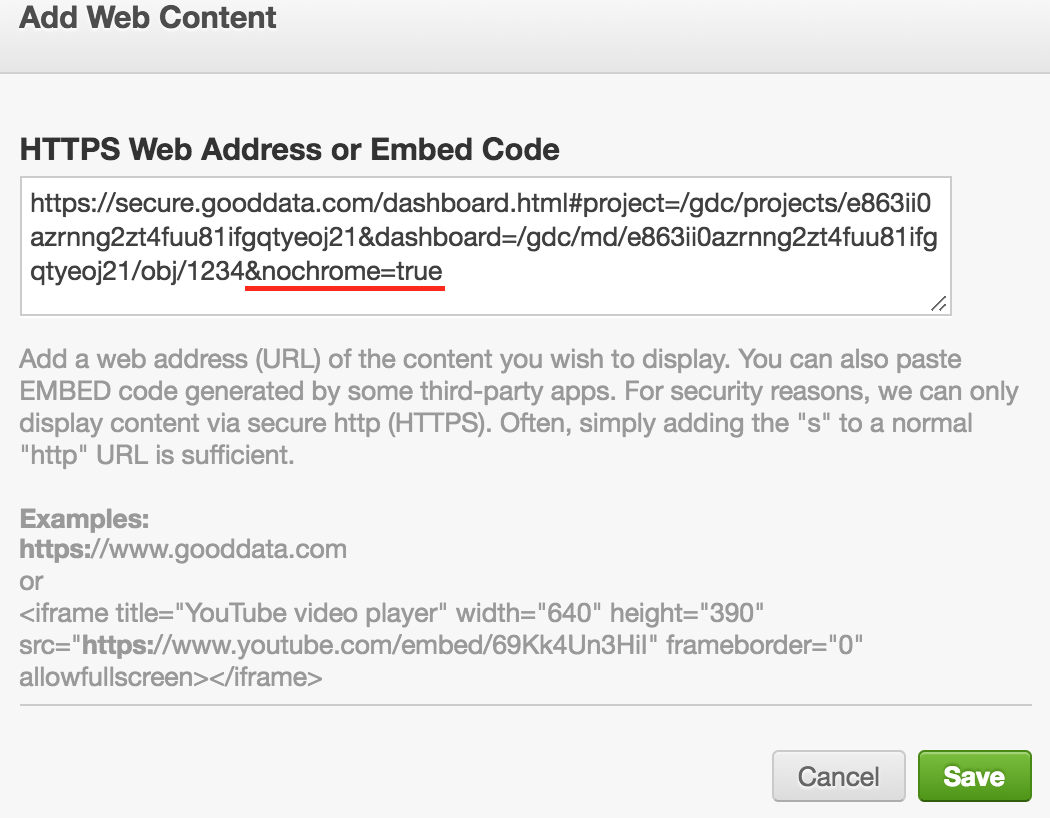
(Optional) To hide the header of the embedded dashboard, enter &nochrome=true in the Add Web Content dialog box.
Hiding the header from a multi-tab dashboard saves spaces and removes all the tabs except the tab that you specify. This is an effective way to limit the information that users can see. For more information, see Hide the Header of an Embedded Dashboard.
Click Save to close the Add Web Content dialog box.
Click Save in the upper right of the dashboard to exit edit mode.
Refresh the dashboard.
Multiple filters based on different attribute labels are combined using the AND logical operator.
To make your embedded dashboard dynamic, add an attribute value wildcard that your system can programmatically replace with an appropriate value. You can thus filter data in different ways to use with different types of users. For example, your system can replace the
region_parameterwildcard withEast, and so on.