Review a Log of Data Loading Process Execution
When a data loading process runs, the history of the process execution is stored. For each execution, a log is generated containing the status messages of the steps of the process run.
If you are using the Chrome browser, GoodData provides a useful extension to assist in monitoring and debugging process execution (see GoodData Extension Tool for Chrome).
Steps:
From the Data Integration Console (see Accessing Data Integration Console), click Workspaces.
Click the name of the workspace that the schedule belongs to.
Click the schedule to open it.
Scroll down to the bottom of the schedule details dialog, and review the history of the schedule executions. For example, the following picture shows the last seven days of executions of the data loading process:
For each execution: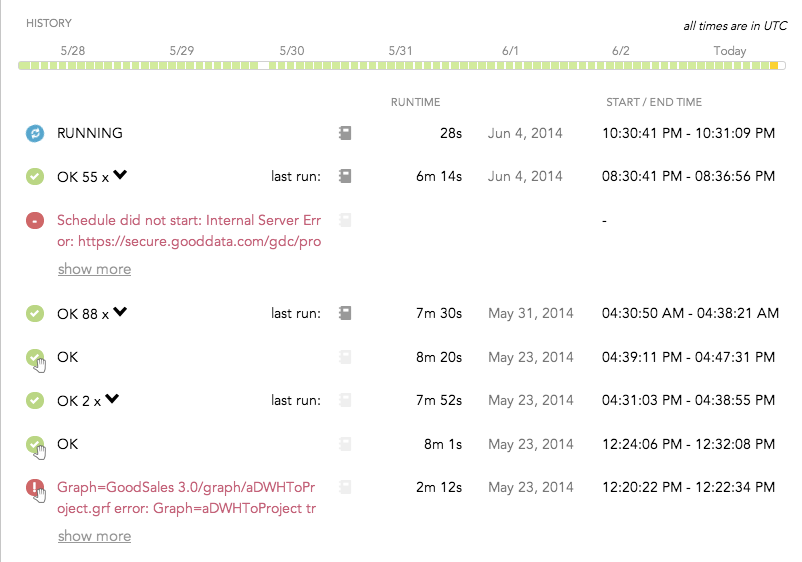
- The icon on the left side of the screen indicates whether the process executed successfully or not. A hand icon indicates an execution that was triggered manually.
- Red text indicates that the process encountered an error and failed.
- The runtime duration, the start timestamp and end timestamp are provided.
Review the state of each execution. An execution can have one of the following states:
Successful: All of your processes should be listed in this category. Fix or disable those that are not.
Failed: Executions that failed to complete or that were manually stopped have been marked in red. The displayed ERROR message provides information on what caused the process to fail. Stopped processes are categorized as errors, since the data load is incomplete. All incomplete loads are treated as errors.
Executions that have failed may have no data updates or incomplete date updates applied to the target workspace. Explore and resolve failed executions as soon as possible to prevent users from working with inaccurate data. Try to keep the count of failed executions at 0.Running: Scheduled execution has begun in the platform. A time stamp indicates when the execution began and the current duration of the execution.
Scheduled: The process has been scheduled for execution at the appropriate time.
Disabled: The scheduled process has been disabled. It will not automatically run until you re-enable it. You can manually re-run disabled schedules, although there are some risks with doing so.
Broken schedule: Schedules whose process no longer exists are marked as broken schedules. Typically, schedules are broken if a process is redeployed under a new name. To fix the scheduled processes, select the appropriate process to run in the schedule definition.
Unscheduled: These processes do not have a schedule associated with them.
To review the details of a specific process execution, click
. The details open as plain text in a new browser tab. Secured parameters are not displayed.
To review the log generated for a specific execution of a data loading process, click
. The log opens as plain text in a new browser tab. To locate errors, search the text for
ERROR.By default, the detail level of execution logs for Ruby scripts (see Deploy a Data Loading Process from a Ruby Script) is set to
INFO, and for the data pipeline bricks (see Data Preparation and Distribution Pipeline) it is set toDEBUG. To change the detail level, add theGDC_LOG_LEVELparameter to the schedule of a Ruby brick or a data pipeline brick, and set it to the required level (see Schedule a Data Loading Process and Configure Schedule Parameters):DEBUGINFOWARNERRORFATAL
(Only for Ruby scripts deployed from Git) Hover over a particular commit item to display the script details: Git commit hash, and information about who deployed the script and when the script was deployed. For more information about Ruby scripts, see Deploy a Data Loading Process from a Ruby Script.