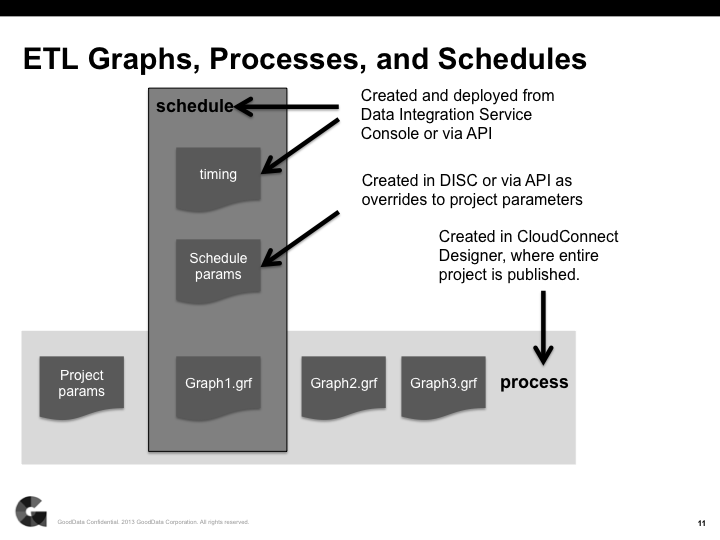
Interactions between Data Integration Console and CloudConnect Designer
CloudConnect is a legacy tool and will be discontinued. We recommend that to prepare your data you use the GoodData data pipeline as described in Data Preparation and Distribution. For data modeling, see Data Modeling in GoodData to learn how to work with Logical Data Modeler.
The CloudConnect Designer desktop application is used to develop logical data models and ETL graphs. All graphs that you have deployed are available in Data Integration Console.
- A graph is the graphical representation of the set of transformations required to extract, transform, and load source data into your GoodData project. A graph is the minimum unit of processing that can be executed at one time and is specified in a single file. Graphs are defined in CloudConnect Designer, from which they are published to one or more GoodData projects in the platform.
- A process is one or more graphs of a CloudConnect project deployed into the GoodData Platform.
- A schedule is the automated execution of the graphs in a deployed process. Schedules can be created only after the process has been deployed into the platform; they cannot be created in CloudConnect Designer.
In the following diagram, you can review the relationships between graphs, processes, and the schedules defined in the Data Integration Console to manage them.
In this image, the Data Integration Console manages the definition of the following items:
Timing. Associated with each schedule is the interval between executions of the ETL graph. Graphs can be scheduled to execute as frequently as every fifteen minutes. See Schedule a Data Loading Process.
Schedule parameters. As part of any schedule, you can define specific parameters to apply to the graph when it executes. For example, you can define separate schedules to pull from specific user accounts in a source system by defining schedule parameters for the graph’s execution. See Configure Schedule Parameters.
These parameter settings override any settings defined for the project parameters, which are defined within CloudConnect Designer and are included as part of the CloudConnect project definition. See CloudConnect - Using Parameters.Graph. Each schedule is associated with an individual graph. Depending on how the ETL is designed, however, this graph can be an orchestrator graph, which calls a number of other ETL graphs as part of its normal operation.
Notifications (not pictured). For each process, you can define notifications to alert stakeholders on the status of process executions. These notifications are specific to the selected process only. See Create a Notification Rule for a Data Loading Process.
A notification applies to all schedules of the entire process. If the process contains multiple schedules, the notification should be designed to support all schedules of the process.
Process Deployments
When a process is deployed to the platform, it becomes an unscheduled process in the Data Integration Console.
Unscheduled processes must have schedules associated with them before they can be executed in the Console.
A scheduled process is a process in the Data Integration Console for which a recurring schedule has been created. When the process is scheduled to execute, it is queued for processing by the GoodData Platform.
Scheduled processes can also be executed on-demand, although there are some considerations to review before executing processes off of their normal schedule. See Run a Scheduled Data Loading Process on Demand.
