Concepts
This topic is part of the tutorial that is intended for developers who plan to work on data models and ETL using CloudConnect.
If you are interested in creating reports, dashboards, or metrics, start with Dashboards and Insights.
CloudConnect is a legacy tool and will be discontinued. We recommend that to prepare your data you use the GoodData data pipeline as described in Data Preparation and Distribution. For data modeling, see Data Modeling in GoodData to learn how to work with Logical Data Modeler.
Before you start, familiarize yourself with how the various components of the GoodData platform work together.
The GoodData platform can deliver reports generated from data from various sources. The GoodData platform allows users to carry out ad-hoc analysis to answer pressing business questions. This topic provides a brief conceptual overview of the fundamental elements of the platform.
A GoodData Project
In GoodData, the basic unit of development is a GoodData project. A project consists of user-defined metrics, reports, dashboards, and underlying technical objects that gather and store the project data. For those familiar with the standard business intelligence architecture, a GoodData project corresponds to the concept of a data mart.
The following picture shows the hierarchy of a GoodData project:
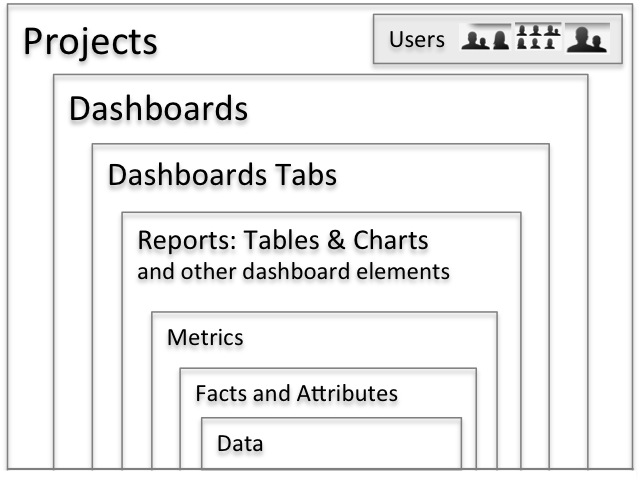
Facts and Attributes
The foundation of the project is the data that is uploaded to it. Raw data is stored as collections of facts and attributes:
- A fact is a quantitative value, or numerical record, that can be used as input for metrics that can be defined in GoodData.
- An attribute is a qualitative text fragment or a numerical value that can be used to slice or segment your reports. For example, ‘Browser Version’ or ‘US Region’ values are stored in attributes, which serve as categories for segmenting report values.
Metrics
In GoodData, numerical values that appear in reports (that is, charts and tables) are metrics. Metrics ‘summarize’ individual numerical records by aggregating individual fact values with functions such as SUM (sum), MAX (maximum value), MIN (minimum value), and AVG (mean).
In some cases, attribute values can also be aggregated into metrics that may be displayed in a report. For example, the COUNT aggregation function counts the number of unique values of an attribute, like all values in the ‘Region’ attribute. For more information, see GoodData Glossary.
Breaking Down and Filtering Data
After you have added one or more metrics to a report, you can slice them (break down, categorize) by attributes, for example, by region or by customer type.
You can also use filters to limit the data that goes into metric computations for a report, for example, Year is 2012 and Quarter is Q2.
In the case of dashboard filters, dashboard users can limit the data that goes into metric computations across an entire dashboard.
Report Types
GoodData supports a variety of report types and many configuration options for each type. For more information, see Chart Types.
Dashboards and Dashboard Tabs
You can organize groups of reports on dashboard tabs. Typically, a dashboard tab is designed to satisfy a specific use case. A collection of dashboard tabs is a dashboard, which often addresses an individual business process.
A project can contain one or more dashboards. Each dashboard can contain one or more tabs. Each tab can contain multiple reports or other objects such as widgets, text, dashboard filters, or embedded web content.
For security reasons, report objects in one project cannot be shared with another project. However, you can export and import report objects using the GoodData APIs.
Users and Domain
You can add or invite users to a project. Project users can collaborate over the project’s contents with other users. You can restrict certain users’ access to certain areas of a project. For more information, see Managing Users in Workspaces.
Users and all projects associated with a GoodData customer are stored in a GoodData entity called a domain (previously known as ‘organization’). A GoodData domain corresponds to a database partition at the technical level.
Creating a Project
When creating a GoodData project, you are dealing with the following activities:
- Data modeling
- Data loading
- Project administration
- Dashboard creation
Data modeling and data loading are done using CloudConnect. CloudConnect is a desktop application where you can build graphical representations of your data models and ETL (Extract - Transform - Load) graphs and then publish them to your GoodData projects.
- A data model defines the relationships between facts and attributes in your project. When data is loaded into the project or when project users query for the data, the data model is used for storing and retrieving data from the underlying database.
- An ETL graph is a graphical representation of an ETL process that extracts data from an enterprise data source, transforms it for use, and loads it into the designated GoodData project. You build these processes locally in CloudConnect and publish them into the GoodData platform where you can then schedule and manage them.
In GoodData, you need to build only the logical data model. The GoodData platform automatically builds an underlying physical data model that defines the tables in the database to store the data.
You may need to create or interact with other components of the GoodData platform, such as the GoodData APIs. These components are not described in this tutorial.
Supplying Data to a Project
The following picture shows how data is supplied to the GoodData platform and what objects you have to create to integrate data into your projects.
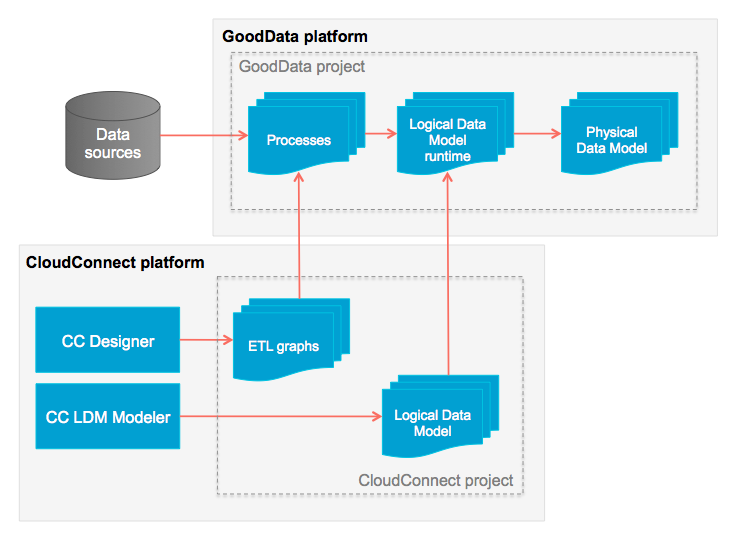
You can see the objects that you would create in a CloudConnect project, including ETL graphs and a logical data model. When published, these items are copied to the GoodData platform and associated with the designated GoodData project. After publishing, you can schedule automated ETL processes to regularly update your projects data.