Combining Google Analytics and Twitter Search Projects
CloudConnect is a legacy tool and will be discontinued. We recommend that to prepare your data you use the GoodData data pipeline as described in Data Preparation and Distribution. For data modeling, see Data Modeling in GoodData to learn how to work with Logical Data Modeler.
In this tutorial, you learn how to combine two CloudConnect projects into a single project, for which you may find multiple use cases.
For example, during implementation of a project, you may decide that it is easier to break the project into separate pieces, each of which is developed by a separate individual. Or, as in this case of this tutorial, you may wish to bring together separate projects so that you can build metrics and reports that realize the potential of business intelligence solutions.
For this tutorial, you will combine two of the CloudConnect example projects: the Google Analytics demo project and the Twitter Search project. When these two projects are integrated into the same CloudConnect project, their data models are joined together using a single Date dimension, which enables reporting across the datasets.
Prerequisites
Before you begin, please verify that you have access to or have completed the following:
CloudConnect Designer. For more information, see the Downloads page at https://secure.gooddata.com/downloads.html.
If you are a white-labeled customer, log in to the Downloads page from your white-labeled domain:https://my.domain.com/downloads.html.GoodData account. For more information, contact GoodData Support.
Google Analytics account & website with some data.
Completed tutorial to create and publish the Google Analytics demo project. For more information, see Analyzing Website Traffic Using Google Analytics.
Twitter Developer App: The provided CloudConnect project is preconfigured to use a GoodData developer application. This tutorial is designed to enable you to gather your own Twitter data, for which you should use your own developer application for authentication. Further instructions are listed in the following section.
Completed tutorial to create and publish the Twitter Search demo project. For more information, see Analyzing Twitter Search.
Project Overview
The basic approach is to integrate the content from one project into the other and then to connect the pieces together.
To connect the logical data models together, you must bring the two LDMs into the same file and then physically connect them together through a shared attribute or dimension.
For transactional data such as the contents of these two projects, the easiest point of connection is to share a Date dimension. For other systems, you may be able to share some form of unique transactional identifier, such as an Order Number. In some cases, you may be required to create a new identifier and to populate it with data. Hopefully, that data can be managed through the host systems.
After the logical data models have been connected, you must refine the ETL graphs to include the connecting object. Generally, the ETL graphs can remain in separate files and can continue to exist independently. Depending on the integration, you may choose to combine them together.
In this tutorial, the Date dimension from the Twitter Search project is replaced by the corresponding Date dimension in the Google Analytics project. Then, the ETL for the Twitter Search project must be modified to reference the new Date dimension.
Set up the Project
In CloudConnect, you can now set up the project into which you will be integrating these two projects. Since it is the larger project, you should use the Google Analytics project as the base project, into which you import the elements of the Twitter Search project.
The first step is to create a copy of the Google Analytics project.
Steps:
- In CloudConnect Designer, close any tabs that are opened to the Google Analytics project’s ETL graphs or logical data model.
- In the Project Explorer panel, secondary-click the Google Analytics project and select Copy.
- Secondary-click again and select Paste.
- In the dialog, enter the following for the name:
Google Analytics and Twitter Demo. - Click OK.
A copy of the Google Analytics project has been created and is available in the Project Explorer.
Acquire Assets from Twitter Project
Now, you need to integrate the components of the Twitter project. In this case, you want to export and import the following things:
- ETL graph (contained in the
twitter.grffile) - logical data model (contained in the
twitter.ldmfile)
Complete the steps below to integrate these two elements into your project.
Export ETL Graph File
Steps:
- In the Project Explorer, select the Twitter Demo project.
- Open the
graphfolder. - Secondary-click the
twitter.grffile and select Export…. - The Export Wizard is displayed. Under the General folder, select
File System: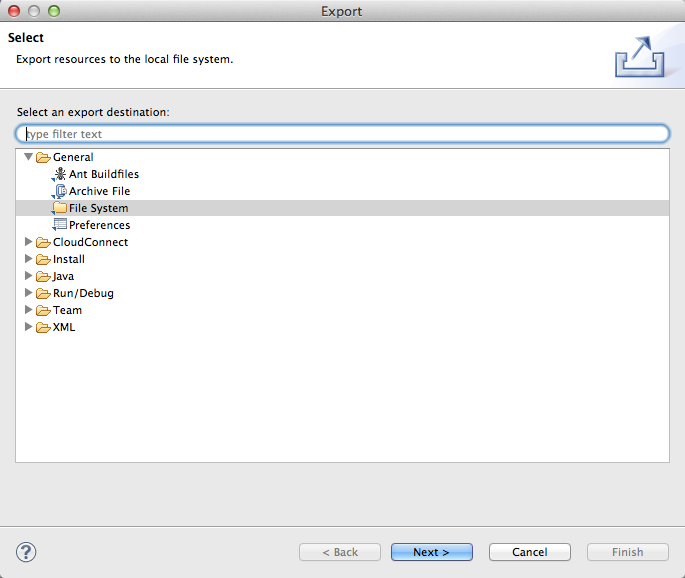
- Click Next.
- Verify that the
twitter.grffile is selected. You may choose a different export location if desired. This location is just used for the export/import process.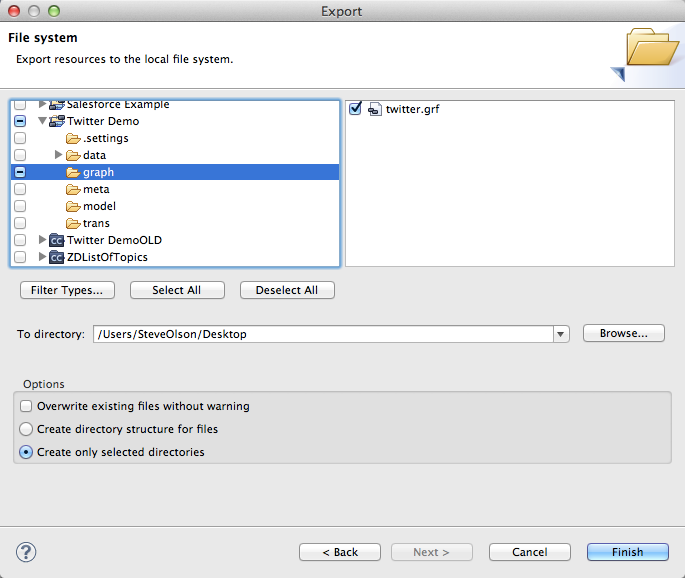
- Click Finish.
The graph file is exported to the specified location.
Export logical data model file
While it is possible to use simple copy-and-paste to bring the Twitter Search logical data model into your project, you are better served by using the following steps.
You can import the logical data model from a separate project directly. Then, you can mash the two models together through a common connection and publish the resulting data model to a completely new project.
Steps:
- Open the
modelfolder. - Secondary-click the
twitter.ldmfile and select Export…. - Repeat the steps in the Export Wizard to export the logical data model to the same location where the ETL graph file is stored.
- The logical data model file is exported.
The logical data model file is exported to the specified location.
Import Assets into Google Analytics Project
Import ETL graph file
Use the steps below to import the ETL graph file into the Google Analytics and Twitter Demo project.
Steps:
- In the Project Explorer, select the Google Analytics and Twitter Demo project.
- Secondary-click the Google Analytics and Twitter Demo folder in the Project Explorer and select Import….
- The Import Wizard is displayed. From the list of source, select
File System: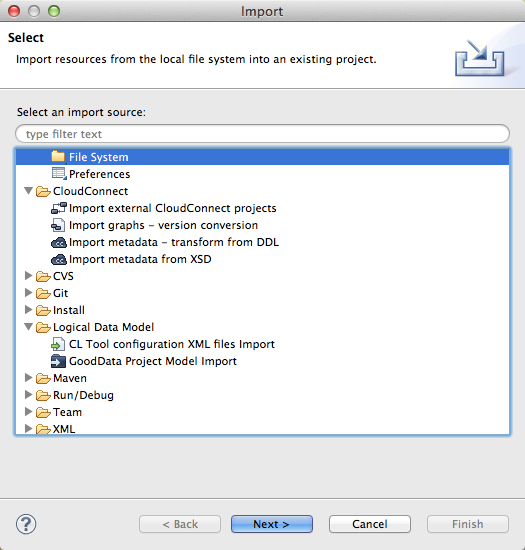
- Click Next.
- In the next step, click the Browse button next to the From directory textbox. Navigate your local environment to select the twitter.grf file. Click Open
- In the Wizard, the list of files in the selected directory is displayed. Click the checkboxes next to
twitter.grfandtwitter.ldm. - For the Into folder setting, you can leave the current value.
- The Wizard should look like the following:
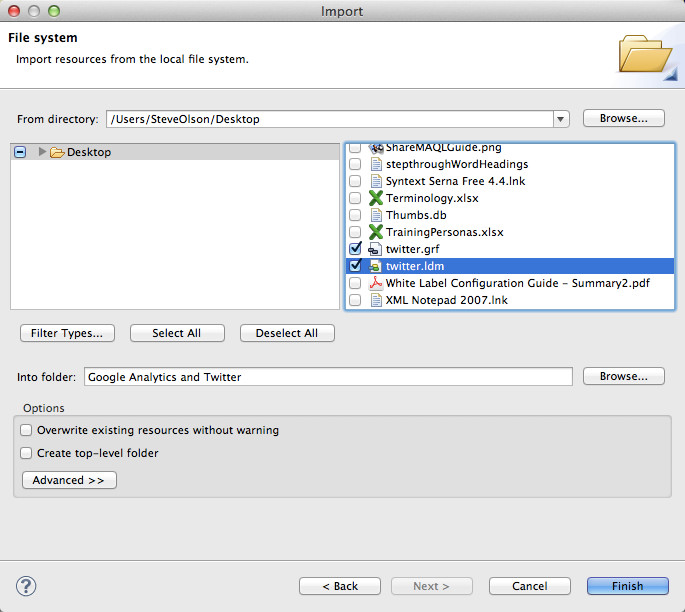
- Click Finish.
- The two files are imported into the top-level folder of the project.
- Drag and drop the
twitter.grffile into thegraphfolder. - Drag and drop the
twitter.ldmfile into themodelfolder. - Save the project.
Integrating the Imported Assets
The base assets have been imported into the combined project. Now, you must connect the Twitter Search assets into the existing assets for the Google Analytics project.
Integrate Twitter data model
The logical data model for the project is now contained in two separate files. Through CloudConnect Designer, you can publish to a GoodData project the LDM contained in a single file at a time. So, you must bring the contents of the twitter.ldm file into the googleanalytics.ldm file. To do so, you may use copy and paste.
Steps:
- Open the
twitter.ldmfile and thegoogleanalytics.ldmfile in the combined project. - In the
twitter.ldmtab, click and drag a selection rectangle around all items on the canvas. Copy the contents. - Select the
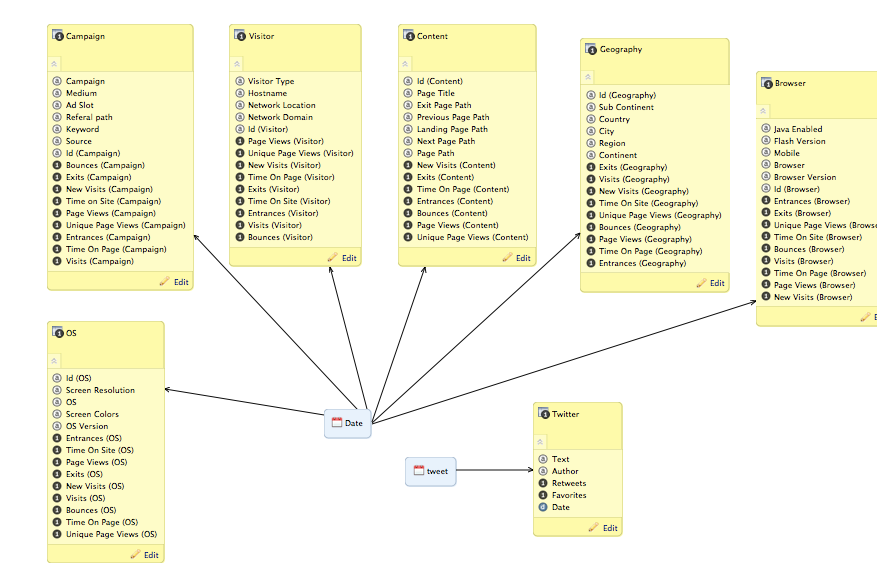
googleanalytics.ldmtab. Paste the contents. - You should drag the pasted contents so that the two date dimensions are next to each other. Your screen should look like the following:
- Save the file.
Connect the data models
To connect the integrated data models, you must delete the Date dimension from the Twitter Search project (called, tweet) and connect the remaining Twitter Search LDM objects to the Date dimension from the Google Analytics project.
Steps:
- Secondary-click the
tweetDate dimension and select Delete. The Date dimension and its connection to theTwitterdataset are removed. - Hover the mouse over the Date object so that an arrow appears at the side of it. Click and drag the line to the left side of the Twitter dataset. When you release the mouse button, the connection is made.
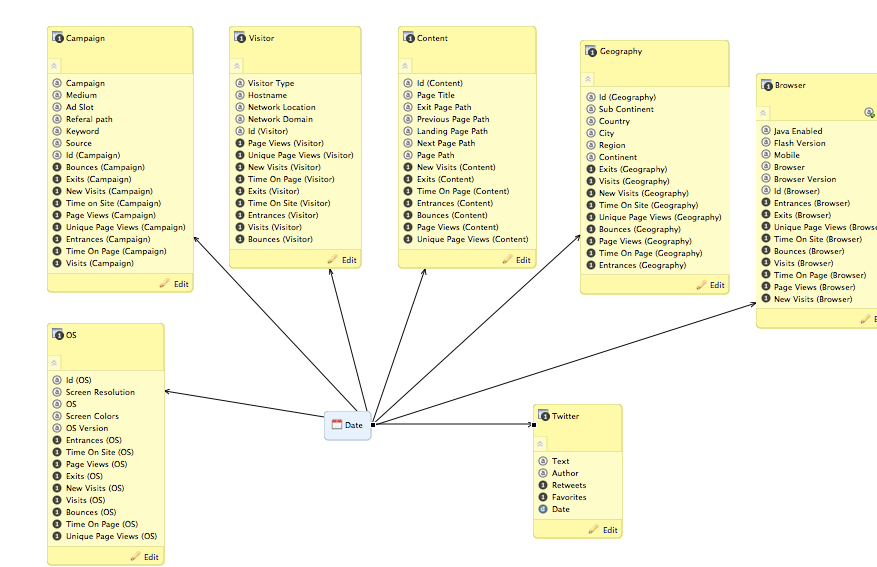
- Save the file.
The two LDMs are now connected.
Publish the LDM
In order to be able to configure the ETL to write to the appropriate fields in the GoodData project, you must publish the combined logical data model to the GoodData project at this time.
To publish, verify that you are looking at the combined LDM. Then, select any whitespace area in the logical data model and click Publish model to server. Select or create the Google Analytics and Twitter project.
After the project has been updated, you should verify that the logical data model has been updated through the GoodData Portal.
Update the Twitter ETL to use the new date dimension
You must now update the ETL for the Twitter data feed to use the Date dimension from the Google Analytics project. In this case, you must map the previous field to the new field in the logical data model.
Steps:
- Click or open the
twitter.grftab. - In the graph, double-click the GD Dataset Writer component.
- The component configuration is displayed.
- Click the Field mapping entry. Then, click Browse…. The Dataset field mapping window is displayed:
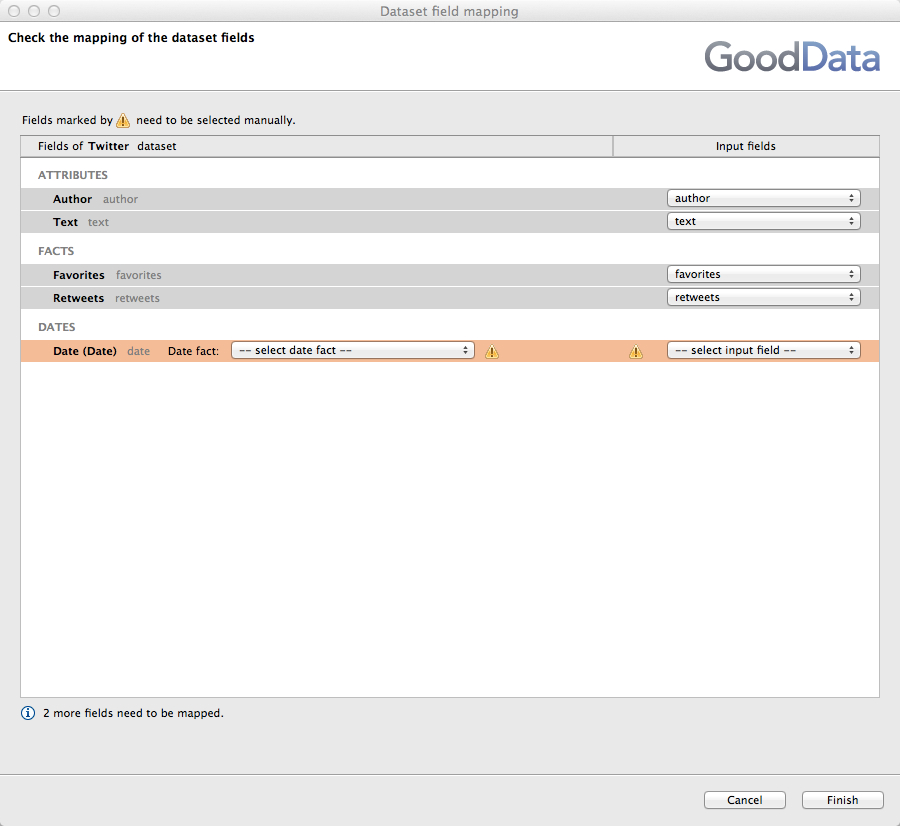
- Dataset field mapping window
- Figure: Dataset field mapping window
- Under Dates, click the Date fact drop-down. Select
Date (tweet). You have mapped the field in the logical data model. - Under the Input Fields column, click the corresponding drop-down for the field you just set.
- Click Finish. Click OK.
- Select
tweet. - Save the file.
The new field in the ETL graph is connected to the LDM.
In the configurations for the other components of the ETL graph, the labels for the field mappings do not correspond to the new name. However, since the data is internal to the graph, they are consistent and still work. Feel free to update the labels for clarity.
To test the graph, secondary-click in the white space in the graph. From the drop-down, select Run As > 1 Graph (Locally). Verify that a success message is displayed in the Console tab.
Since the full ETL for the project is contained in two separate *.grf files, you must run the graph in each file. You may find it easier to copy and paste the contents of the second graph file into the first and remove the second *.grf file from your project. Then, you can run the ETL for the entire project from a single command. For more complex projects, however, it may be easier to manage graphs through multiple tabs/files.
Run Google Analytics graph
Before you publish your project to the GoodData platform, you should verify that the Google Analytics graph is working properly.
Steps:
- Open the
ga.grffile. - Enable debugging in all edges in the graph.
- Run the graph locally.
- Verify that there is an adequate set of records being passed into the GD Dataset Writer.
- If you made changes, save the file.
Create a Report
After you have run the graphs locally, you should also review the data inside the project in the GoodData platform. In the steps below, you create a simple data validation report to verify that the data has been properly loaded and can be sliced by Date.
Steps:
- Login to the GoodData Portal.
- From the Projects drop-down, select the project to which you published your project.
- Click the Reports menu.
- Click Create Report.
- Click the What tab.
- Click the Add New Metric link.
- For the # of Tweets metric, select
COUNTfor the Operation. For the Perform Operation On value, selectText. For the name, enter# of Tweets. Do not add to global metrics. Click Done. - The report is generated. If you have been able to extract Twitter data via the Twitter graph, the report should display a positive integer value in the report for the
# of Textvalue. - Click the What tab again.
- Click the Add New Metric link.
- For the # of Visits metric, select
SUMfor the Operation. For the Perform Operation On value, select NewVisits (Visitor). For the name, enter# of Visits. Do not add to global metrics. Click Done. - The report is updated to contain two metrics side-by-side.
- Now, you can slice the date by the date dimension. Click the How tab.
- Click All Attributes. Then, select the Date (Date) checkbox. Then, click Done.
- The report now contains the number of tweets and number of visits tracked per date.
Delete twitter.ldm File
After you have validated that the data has been uploaded, you should remove the twitter.ldm file from the combined project.
Steps:
- In the Project Explorer tab, open the
modelfolder of the combined project. - Secondary-click the
twitter.ldmfile and select Delete. The Twitter LDM is removed from the project.
Publish to a New Project
When the validation report is complete, you can publish the CloudConnect Designer project to the platform.
By default the Twitter graph is designed to do a full replacement of the data each time it executes. Since the Twitter Search API limits the number of tweets retrieved per query to 100, at most you can retrieve 100 tweets of the most recent data at a time. Making the modifications to gather historical data exceeds the scope of this document.
- For more information on making the changes to support repeated execution of the Twitter Search API, see GoodData CloudConnect Tutorial.
Steps:
- When you are ready to publish the project, click the Project Explorer tab.
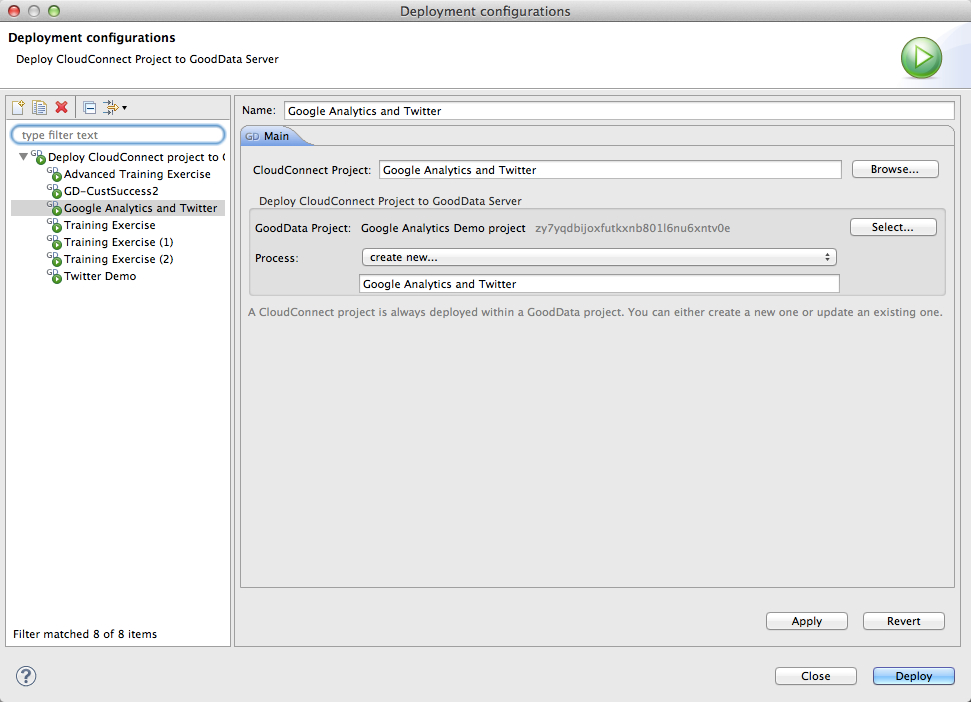
- Secondary-click the project containing the Twitter and Google Analytics items. Then, select Deploy As > Deploy CloudConnect project to GoodData Server.
- The Deployment configurations window is displayed.
- Deployment configurations window
- Note that you are creating a new Process, which contains the runtime components of the ETL graph that you authored in CloudConnect Designer. A process includes the graph and any associated
- schedules that you create for it (see below).
- Verify that the value for the GoodData project corresponds to the project to which you wish to publish your CloudConnect project. To choose a different project, click Select and make your selection.
- To deploy the CloudConnect project to the GoodData project, click Deploy.
- In the Console tab, a success message indicates that the project has been successfully deployed.
After the project has been deployed, you can schedule periodic execution of the ETL. For more information, see Automating a Data Loading Process.