CloudConnect Preformat Architecture
CloudConnect is a legacy tool and will be discontinued. We recommend that to prepare your data you use the GoodData data pipeline as described in Data Preparation and Distribution. For data modeling, see Data Modeling in GoodData to learn how to work with Logical Data Modeler.
This article is the first in our series on designing ETLs and data transformation processes in CloudConnect. In this particular article we will focus on dealing with delimited input data. I believe that following this approach will help you in future maintenance of your project and in tracking bugs in your ETL.
Project Structure
With exception of very simple projects, our transformations usually follow this pattern:
- Preformat
- Transform
- GD Load
A question that is often asked is “Do I really need to do this?”. The answer will be in most cases yes. However, if your graph is really simple (e.g. less than 10 boxes) and easy to understand, you will probably save more time by skipping the division into more graphs.
Each piece of the architecture is represented by one CloudConnect graph and the temporary data are usually stored as CSV files. The solution also consists of orchestration graph, which manages ordered execution of sub-graphs. We will focus on the preformat phase in this article.
Preformat Phase
Preformat phase is usually the first step of ETL solution and performs initial data sanitization (converting formats, filtering values). If you receive your data as delimited files of uncertain origin, it is definitely wise to do some initial cleanup. For the sake of our example we will process un-cleansed CSV files as input. Our sample data contains dates, numbers and other entities in non-standard formats. Each of the files could also contain data in different formats. The final aim of this phase is to have data in standard formats in all the output files.
Example
Let’s have a look at our example data now. We have three data files entering our processing. The first file is dumped from employees database and it contains data on users. Our example users.csv file looks like this:
| Id | Login | Created | Team |
|---|---|---|---|
| 1 | neal.caffrey | 6/15/2009 9:45:30 AM | Accounting |
| 2 | petr.burke | 4/25/2011 8:45:30 AM | Accounting |
| 3 | sara.ellis | 10/12/2012 12:35:30 AM | Insurance |
The second file is exported from accounting database and contains data about payments related to the user data. The payment.csv structure is following:
| Id | User Id | Payment | Payment Date |
|---|---|---|---|
| a8f5f167f44f4964e6c | 1 | $2,568.25 | 2012-12-19T8:24+01:00 |
| 93dfcaf3d923ec47467 | 1 | $2,584.48 | 2013-11-11T12:18+01:00 |
| 7qwe05e92c76qwra46d | 2 | $4,284.49 | 2012-08-12T15:20+01:00 |
| 77e05e92c769b7a46d2 | 3 | $3,584.48 | 2011-03-19T16:15+01:00 |
The third file is prepared manually by an accountant in Excel and contains data on user expenses:
| First Name | Last Name | Expense Type | Amount | Note |
|---|---|---|---|---|
| Neal | Caffrey | food expense | 150E | Lorem ipsum dolor sit amet, consectetur |
| Neal | Caffrey | travel | $548 | Donec diam dolor, varius vel malesuada id, viverra at risus. |
| Peter | Burke | travel | $679 | Morbi nec vulputate risus. Nullam sollicitudin sapien vitae justo |
| Sara | Ellis | food expense | $45 | Suspendisse potenti. Vestibulum cursus dignissim viverra. |
When quickly going through the example files, you might notice that each file has slightly different format of entities. This situation is quite common when working with datasets from different sources. It is possible to start processing such dataset without any conversion straight ahead, but this might make maintenance of the project very difficult in future. From my experience, it is always better to choose some ground rules for data at the beginning. We have created small set of question which you might want to ask yourself before going forward with the project:
- Do I have more then one source system or will I have more then three source datasets?
- Are the dates in CSV files in different formats? If yes, is there a preferred format that is different?
- Are the decimal numbers in CSV files in different formats?
- Is the data cleaning needed for any of the source files?
If your reply was yes to one or more of the questions above, I strongly advice you to create a special graph for the preformat phase. In other cases it depends on your judgement, but it’s good to understand you usually can’t go wrong with adding preformat phase. Looking at the example files, my answer was Yes to all questions above, therefore creating the preformat graph is a must for me.
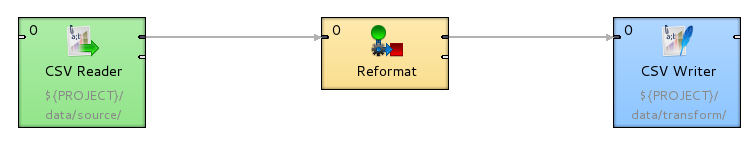
In general, preformat graphs usually contain sets of tree CC components: CSV Reader, Reformat, CSV Writer:
I will start with definition of default formats for data fields. Let’s assume the desired format for datetime fields is yyyy-MM-dd HH:ss:mm (2012-02-10 10:12:35). We can now take two approaches to format conversion:
- Metadata conversion
- CTL conversion
The first approach is done by enforcing the desired format in metadata setting. The second one utilises CTL functions to do the conversion.
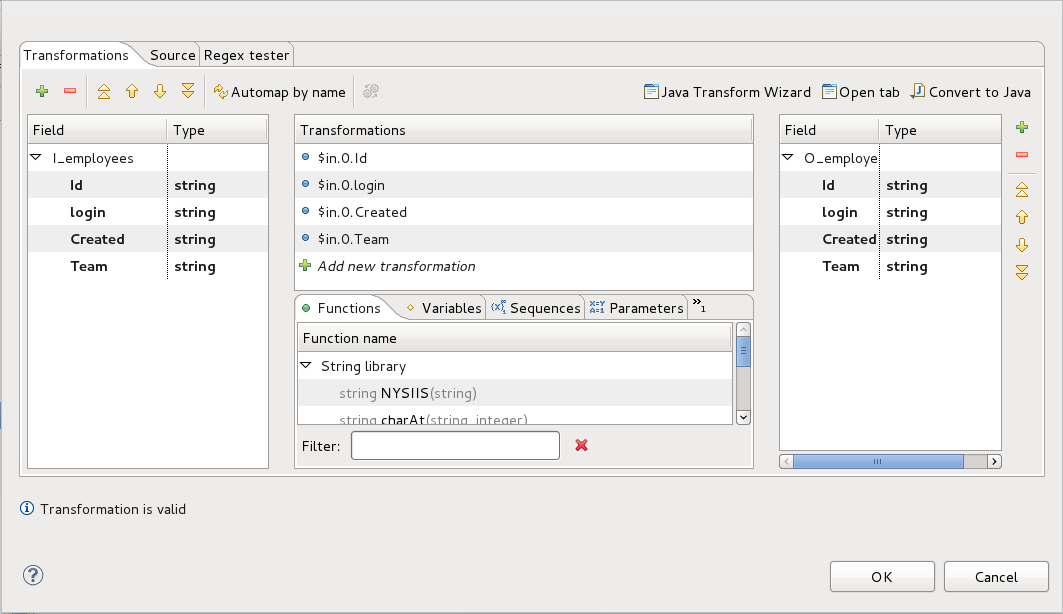
Let’s try both approaches on our example CSV files. We will be using all three components in both cases. After putting them into the graph and connecting them with edges, let’s generate metadata from our employees.csv file, name it I_employees (input) and immediately duplicate it as O_employees (output). Place input metadata on edge from CSV Reader to Reformat and output metadata on edge from Reformat to CSV Writer. All the datatypes in generated metadata should be strings. The last step is creating correct mapping in Reformat component. This can be done by going to Transform definition of Reformat component and clicking on Automap by name button. If you execute this kind of graph (after specifying source and destination file), it should finish without any error. To avoid overwriting data, it is always good to put the converted files in different folder then the source files. In this case, we will use data/source folder for source data and data/transform as the destination folder.
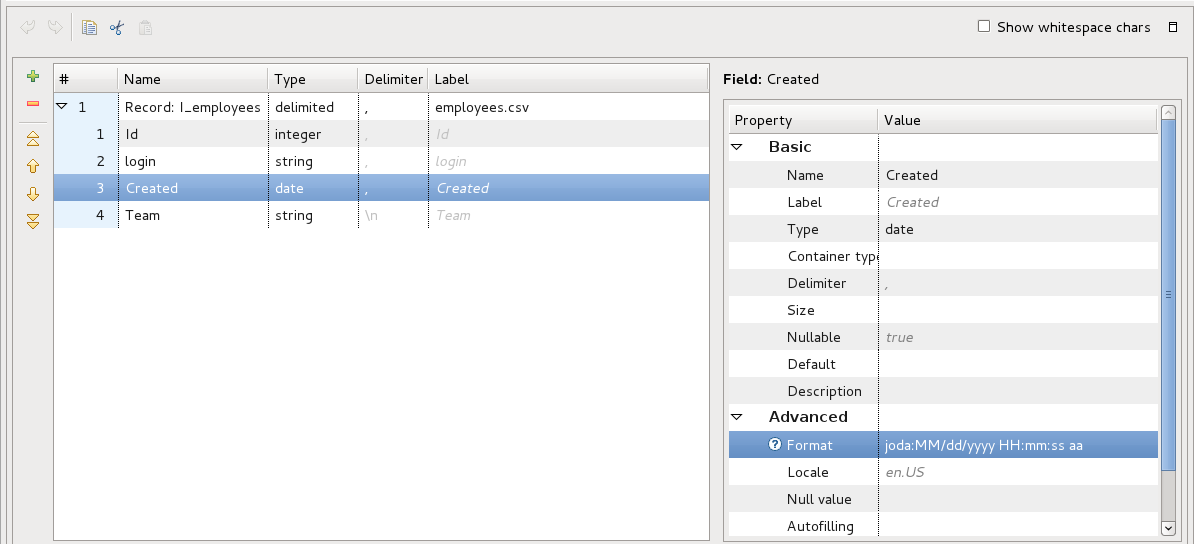
Now we will setup graph to do the conversion. Let’s start with setting data type for Created column in I_employees metadata. In this columns settings, put joda:MM/dd/yyyy HH:mm:ss aa in to the Format field in metadata setting. This way the date will be parsed in CSV reader and automatically converted to internal CC date type. Same way we will edit O_employees metadata and put joda:yyyy-MM-dd HH:ss:mm in format field. This will make the conversion and date in right format will be saved in output folder
The other approach utilises CTL functions. In this case, we are fine with using only one metadata type - let’s name it IO_employees (IO for input/output). The main difference with this approach is we can use string data types only. To convert the format we will use this code:
$out.0.Created = date2str(str2date($in.0.Created,"joda:MM/dd/yyyy HH:mm:ss
aa"),"joda:yyyy-MM-dd HH:ss:mm");
We used two CTL functions: str2date() and date2str(). Detailed information on these functions can be found here and here
Looking further into the CSV files, you can observe another formatting issue. The format of numbers is not same in all datasets - it contains “,” as hundred separator and it also looks that not all values are of same currency. We will fix the separators problem and we could also prepare the currency conversion, but this can be done by lookup setting and it will be covered in other article.
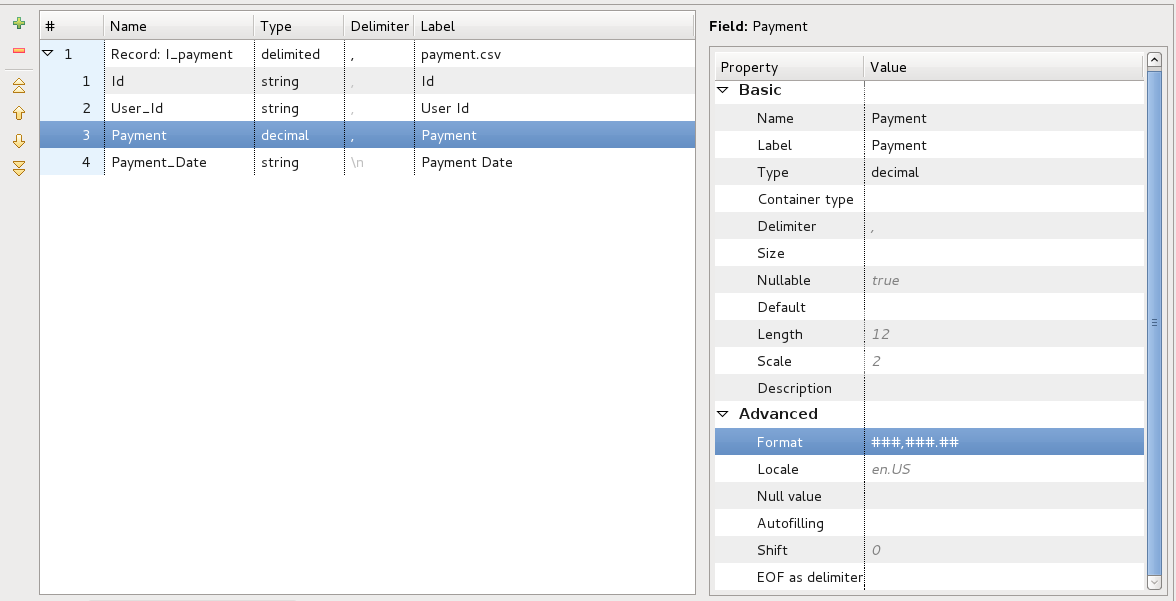
In this case we also have two options how to parse the input data. If we decide for metadata formatting, we will again create two metadata definitions (I_payments, O_payments) and change the Payment field data type to decimal. To parse data correctly we need to put (###,###.##) in the format field. Another two fields worth noticing are length and scale. This two fields set how big number can be stored in the decimal field without being truncated. Default setting is 12,2. This means that number cannot have more then 12 digits and 2 digits must be after decimal dot. If the number will be bigger, graph will fail on error. What remains is changing the output metadata format to (#.##). This way we will not have group separators in numbers. More info about decimal number formatting can be found here
If we decide to rely on CTL functions for the conversion, there is no need for changing data types and we can again have only one metadata IO_payments. In this case, we don’t need to convert data to decimal type. What we need is to remove “,” character from number and this can be easily done using replace function:
$out.0.Payment = replace($in.0.Payment,",","");
The last thing that we might want to do with our example data is creating a login field in excel expense export. As you can see, our expense file don’t contain that information, but we can quite easily create them by combining fields First Name and Last Name. Let’s create two new metadata definitions (I_expenses, O_expenses) and add the login field to O_expenses. Creation of login field can be done by the following CTL code:
$out.0.login = lowerCase($in.0.FirstName) + "." + lowerCase($in.0.LastName);
Summary
Creating preformat graphs is a bit of an investment (time-wise at least). However, by taking the right steps here, you might save yourself a lot of problems with formats in the following phases of ETL. My recommendation is to always spend a few moments analysing the input data and choosing formatting you want to use through your process. Preformat graph will also make you more agile in solving problems with data changes in future, as you will only need to change one graph, not the whole ETL structure.