Analyzing Website Traffic Using Google Analytics
CloudConnect is a legacy tool and will be discontinued. We recommend that to prepare your data you use the GoodData data pipeline as described in Data Preparation and Distribution. For data modeling, see Data Modeling in GoodData to learn how to work with Logical Data Modeler.
In this tutorial, you can customize a provided example CloudConnect project to begin capturing traffic data for your website from Google Analytics.
Prerequisites
CloudConnect Designer. For more information, see the Downloads page at https://secure.gooddata.com/downloads.html.
If you are a white-labeled customer, log in to the Downloads page from your white-labeled domain:https://my.domain.com/downloads.html.GoodData account. For more information, contact GoodData Support.
Google Analytics account & website with some data.
Getting Started with the Project
To begin, download the package, which is stored as a ZIP file.
Open CloudConnect Designer. From the menu, select File > Import. Import the project from the archive (ZIP) file as a CloudConnect project.
The package contains the following:
- model: googleanalytics.ldm
- graph: ga.grf
For each CloudConnect project, you must assign a GoodData working project. To assign, click the Server Explorer tab, and then click the GD logo:

The Create GoodData Project window is displayed. Enter a Project Name and provide a project authorization token. Then, click OK.
For more information about the authorization token, see Find the Workspace Authorization Token.
Reviewing the Logical Data Model
In CloudConnect Designer, open the model/googleanalytics.ldm file to review the data model:

The model contains six datasets: Campaign, Visitor, Content, Geography, Browser, and OS. This model has been designed to fit the ETL graph.
To publish the model, click Publish model to server in the Details sidebar. In a few seconds, the model is published to the GoodData project. You can review a graphical representation of the model in your GoodData project. In the menu, select Manage > Model.
ETL Graph
In CloudConnect Designer, you build ETL graphs to extract, transform, and load data into the GoodData project. An ETL graph contains visual representations of the sequence of activities applied to the data stream, as it is pulled from one data source, transformed in zero or more ways, and loaded into the selected GoodData project.
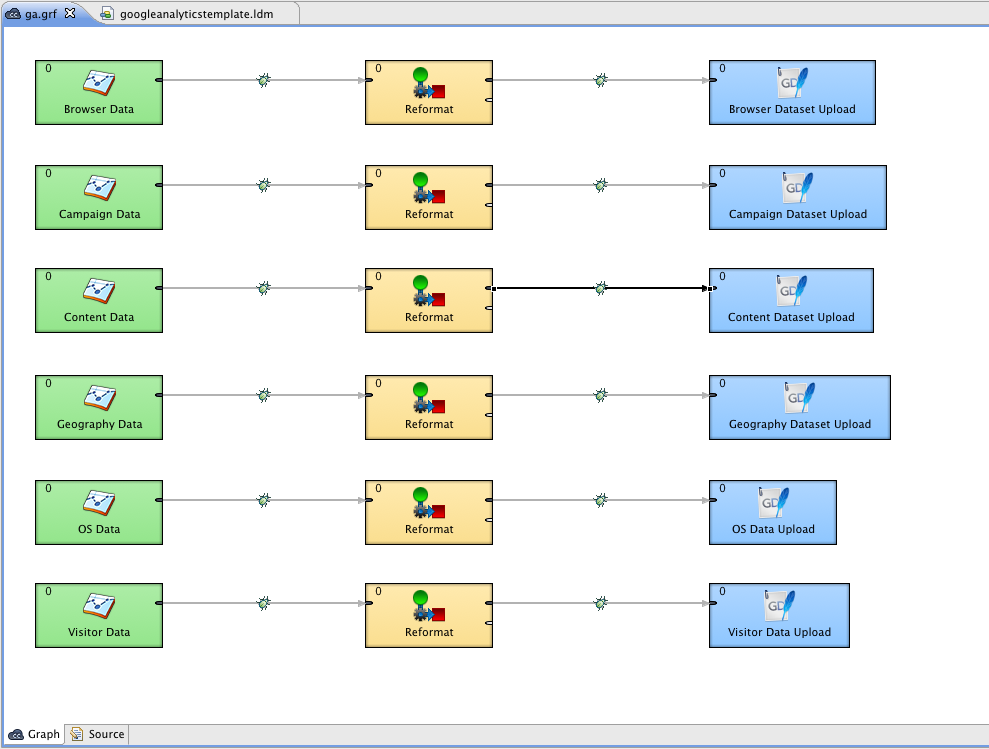
To review the ETL graph for the Google Analytics project, open the tranformation graph (graph/ga.grf) file. There are six straightforward Extract- Transform - Load parts, one for each dataset.
Create Connection
Before you run the ETL graph in CloudConnect, you must provision it with your Google Analytics account information.
The Google Analytics API resource has been deprecated (see Update the Google Analytics Connection in a Project).
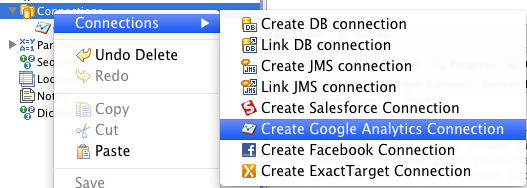
- To create a connect, secondary-click the Connections in the Outline pane. Then select Connections > Create Google Analytics Connection:
- Edit the workspace.prm file that is stored in your project workspace folder. Set up the correct parameters: {PROJECT_ID} - set to the ID of your GoodData Working Project {PROFILE_ID} - set it to your Google Analytics Profile ID
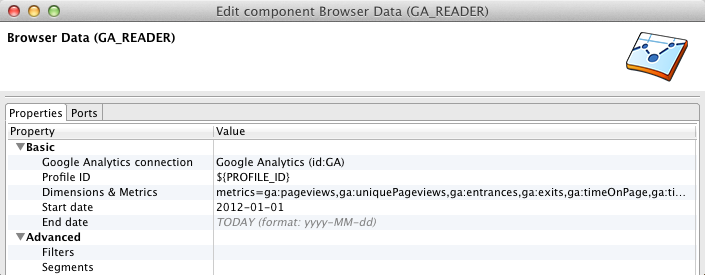
- Now, verify the correct component setup. Check that your Google Analytics connection is setup properly and also review that the Profile ID value is set to use the parameter stored in workspace.prm file.
- If everything looks fine, you may run the graph locally. Secondary-click the white space in the graph and select Run Graph Locally.
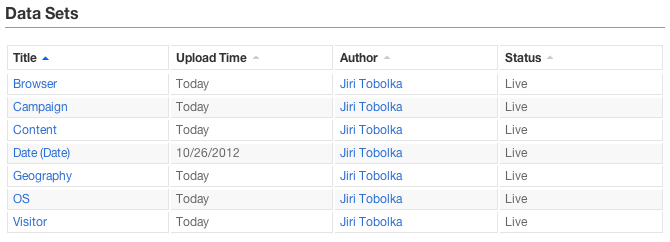
When the graph has been successfully executed, verify in your GoodData project that the data has been uploaded.
You can now begin creating metrics and reports to take advantage of your Google Analytics data.