Workspace Blueprint
This document summarizes GoodData best practices and guidance related to GoodData platform workspace component. The document focuses on performance, scalability, and workspace’s footprint rather than on functional best practices.
Workspace Structure
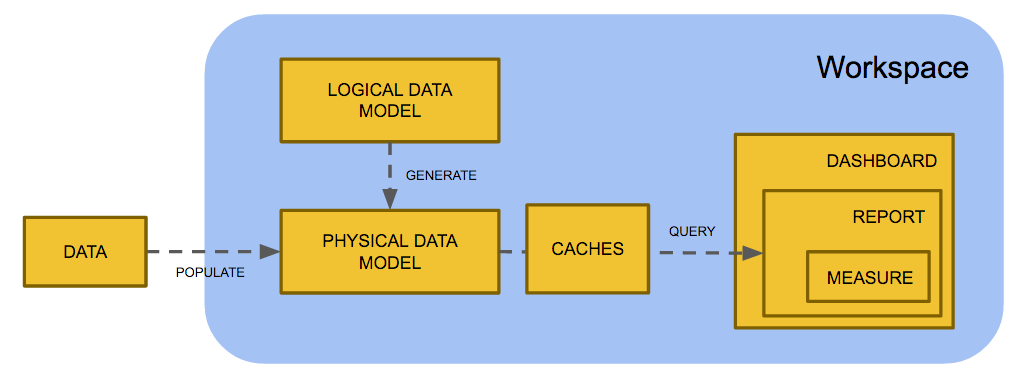
GoodData workspace contains following components:
- Logical Data Model (LDM) defines structure of the workspace’s data in terms of analytical model (facts and attributes).
- Physical Data Model (PDM) is the underlying relational data storage (database tables). PDM is generated from the LDM whenever LDM changes are committed (MAQL SYNCHRONIZE command).
- Analytical Objects (for example dashboards, reports, metrics) define a PostgreSQL based workspace analytical experience, calculations etc. Execution of analytical objects retrieve data from the PDM and presents it to a user.
- Caches are database tables that keep intermediary query results for performance purposes. Caches that have not been used for more than 24 hours are garbage collected.
Workspace provisioning requires a platform token that allocates resources (hardware nodes) for a specific platform tenant (e.g. GoodData customer). The token defines what and how many components (for example ADS, workspace, high performance workspace) a particular tenant can provision and on what HW resources these components will utilize. The token also describes a couple of important platform parameters (e.g. number of users per workspace, API requests rates allowed etc.).
The following sections provide guidance regarding these workspace components.
Physical Data Model
PDM is automatically generated from the LDM. Attributes are represented by a separate table that contains a numeric attribute value (element ID) and all attribute labels (human readable values). Facts are represented as numeric columns in a fact table. Fact table maps to the LDM dataset and contains all the dataset’s facts as columns as well as foreign keys to all attribute tables (the foreign key uses the attribute element ID).
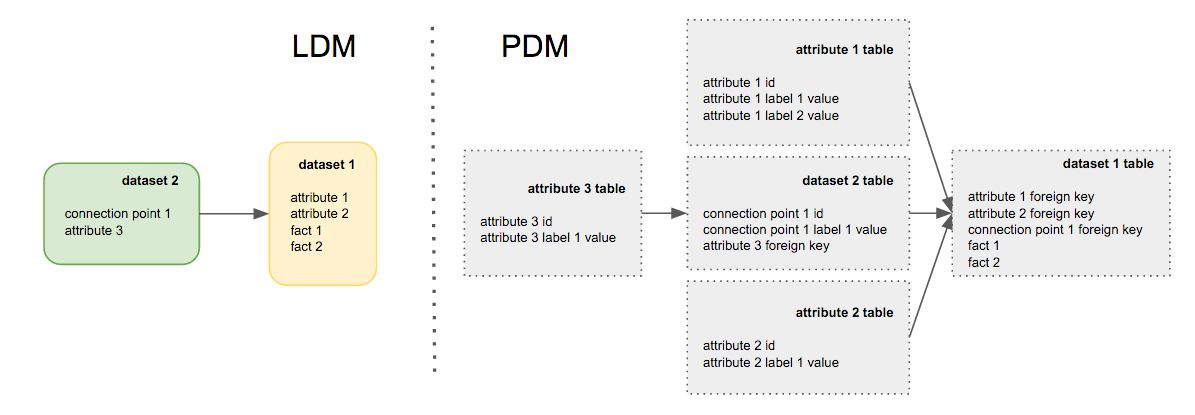
GoodData Extensible Analytical Engine (aka XAE) performs all analytical operations with facts, attribute element IDs and attribute labels (in case of the LIKE operator). It adds human readable attribute labels at the very last step before it sends the data to UI. Most analytical filters reference attribute element IDs.
As you can see, every reference (arrow) in the LDM adds one SQL join to a report SQL query. Table joins are the most expensive database operations. So it is recommended to create as flat an LDM as possible.
GoodData XAE is currently implemented on top of two DBMSes: PostgreSQL and Vertica.
PostgreSQL Workspaces
PostgreSQL is mature row-based DBMS implementation that scales well to many concurrent users and table counts.
As any row-based RDBMS it needs to read the whole table content (all columns) even when a query uses only few table columns.
A typical GoodData report uses only few columns out of many. The LDM to PDM mapping outlined above makes a lot of sense here as all attribute values (labels) are separated to the attribute table. This reduces the fact table size and makes the table scan faster.
GoodData XAE translates all attribute connection points to primary keys and indexes all attribute foreign keys. The indexes are used in situations when query result contains less than ~ 5% of all table records. If the result contains more records, all records are scanned (table full scan). This is why PostgreSQL delivers good performance on top of large data volumes with very selective analytical filters (hit ratio < 5%). Reports that show data for one department (out of hundreds) are typically very fast.
Whenever there are no filters or the filters don’t reduce query result under ~ 5% of the total table size, PostgreSQL scans all records in the table. This operation may take a while on large data volumes. So it pays off to use as selective filters as possible. For example remember dashboard filters (saved filters) for specific use as much as you can.
An initial dashboard execution with no filters can be optimized with pre-calculation.
One of the most time-consuming data operations with PostgreSQL (as with any RDBMS) are joins. Try to design your LDM in ways that avoids unnecessary joins in large tables:
- Keep attributes in fact tables as long as there is no need to connect it to another fact table.
- Don’t use hierarchical LDMs. Connect all dimension directly to fact tables (use star schema, not snowflake).
PostgreSQL can handle workspaces with up to 20M records and / or 20 GB data size (excluding indexes) in the largest fact table. You’ll need to optimize workspace LDM for PostgreSQL to perform well beyond these limits. See the LDM optimization hints below.
Vertica Workspaces
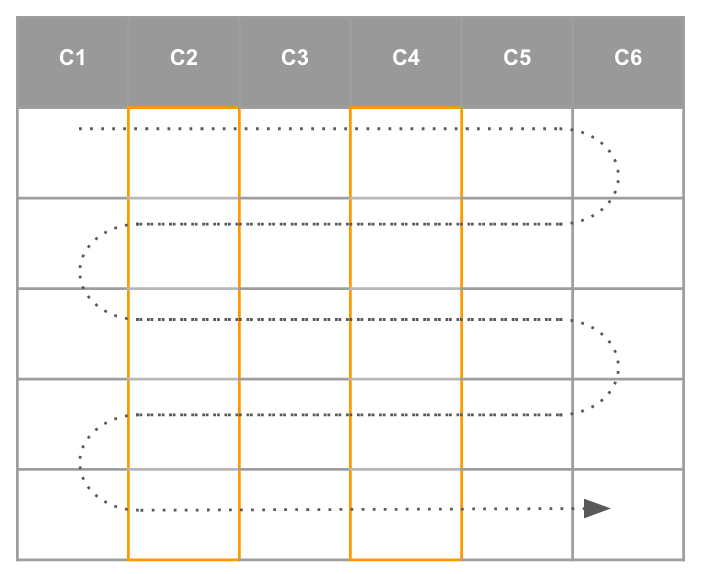
Vertica is columnar database engine with aggressive data compression. The columnar approach significantly reduces the IO footprint of the report queries.

GoodData only currently support a single node Vertica deployment with default table projections (indexing scheme). Because of this default setup, flat LDMs (star schema) work the best with this backend. The Vertica backend currently scales well to hundreds of millions of records and low hundreds of GB data volumes. You’ll need to thoroughly optimize workspace’s LDM to achieve good performance for larger workspaces. See the LDM optimization hints below.
Migration
PostgreSQL based workspace can be exported and imported into an empty Vertica project. For more information, see Clone a Workspace.
All lifecycle management functions as well as metadata export / import work across workspace backend type. For more information, see Migrate Selected Objects between Workspaces.
Vertica based workspace exporting and importing to an empty PostgreSQL based workspace is not supported. All migrations from Vertica to PostgreSQL must be performed manually. This can complicate reverting workspace upgrade from PostgreSQL to Vertica.
Logical Data Model
This section describes best practices for GoodData logical data model (LDM) design. General dimensional modeling best practices are out of scope of this document. For more information about data modeling see Data Modeling in GoodData. Reasoning for many of the recommendation ties back to physical data model (PDM) structure.
Snowflake vs. Star Schema
We strongly recommend keeping your LDM as flat as possible to prevent unnecessary joins in report queries. In other words, use star schema LDM design instead of the snowflake. Your LDM should certainly resemble this LDM:
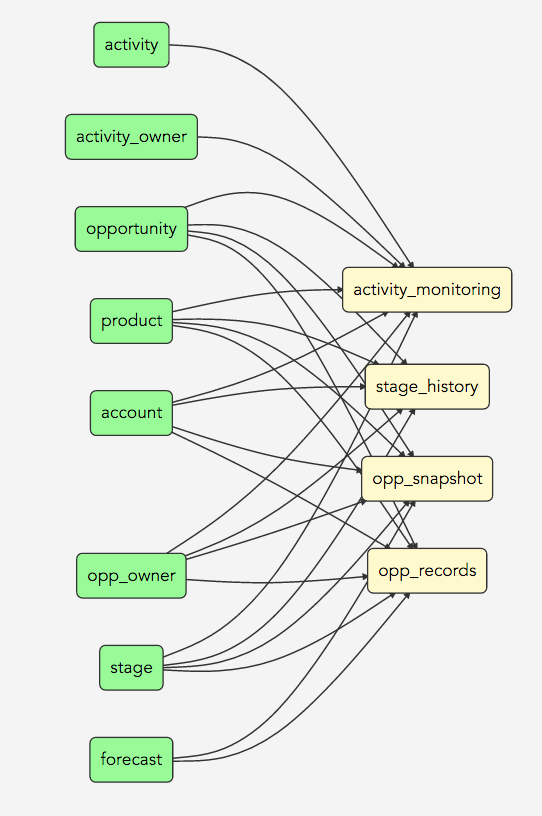
Rather than this one:

If a dimension isn’t shared across multiple fact tables, do not separate it out from its fact table.
Connection Points & Fact Table Grain
Each dimension that is connected to a fact table in LDM must have its connection point (primary key). The GoodData platform stores connection point values in special in-memory structures for faster data normalization during data loading and report computation. These structures scale up to single digit hundreds of millions values. This is why you should not use the connection point in the leaf fact tables in your LDM.
The connection point also plays important role in Incremental Data Loading as records with the same connection point values are updated (instead of appended) during incremental data load. The fact table grain setting is better option for defining the fact table’s primary key. Use it instead of the connection point to make the data loading and reporting faster - for more information, see Set the Grain of a Fact Table to Avoid Duplicate Records.
Always try to use coarser fact table grain. Plan the reports that you are going to need and derive the fact table grain from the reporting requirements rather than using the finest grain for a future flexibility.
The fact table grain performs (sometimes expensive) MERGE SQL operation for inserting an incremental load into a workspace’s dataset. This may lead to long processing (and sometimes even timeouts) in case when the increments are large (10s of millions of rows). Make sure that there is a reasonable cap on the data increment size when using the fact table grain.
Workspace Validation
We recommend validating your workspace on regular basis. For more information, see Validate a Workspace.
LDM Limits
Always keep the number of dataset’s attributes and facts on a reasonable number. Every attribute is translated to a foreign key in a fact table. Every fact maps to a fact table’s column. The fewer columns in the PDM table, the lower IO is needed for PostgreSQL table scans. Consider splitting wide datasets to multiple smaller datasets if most of your reports can use only attributes and facts one of the new datasets (if many reports use more that one smaller datasets the join of these datasets is more demanding than full scan of the single large dataset).
Vertica as columnar engine scales far better to a higher number of columns than the PostgreSQL. Use Vertica PDM backend for wide LDM datasets.
Here are couple more LDM related limits:
Accessing platform limits requires a login to the GoodData Support portal.
Report Execution
Each report execution performs multiple queries against workspace’s PDM. In most cases, every report metric in the report definition (including all MAQL embedded metrics) translates into a single SQL query that is materialized (stored) in a temporary cache table. GoodData reuses the cache tables for other report executions.
Frequent Loads
The cache tables are garbage collected on a regular basis. All cache tables that haven’t been used for more than certain threshold are discarded. All cache tables that contain data from a specific dataset are invalidated every time when the dataset’s data is reloaded (no incremental cache update). So every data load potentially invalidates many cache tables that remain in the PDM until the next garbage collection. Every subsequent report execution creates new cache tables. In cases when data is uploaded frequently, many sets of outdated cache tables remain in the PDM. Moreover, frequent report execution makes each set even bigger. We’ve seen hundreds of thousands of cache tables accumulated during the period between two garbage collections.
You want to limit the frequency of the data loading to prevent this issue. You can also improve this situation with load balancing users among multiple workspaces (with the same or partitioned data).
The Vertica PDM backend is particularly sensitive to the number of tables in a single schema. You should take this into account when migrating from PostgreSQL to Vertica.
Avoid small-size or even empty data loads. It is always better from the performance perspective to accumulate the data and perform one larger data load rather than many small data loads.
Data Permissions
Data permissions (aka Mandatory User Filters - MUFs) generate separate sets of caches for each unique combination of the data permission’s filters. This makes the problem with many cache tables in the PDM backend’s catalog much worse. We recommend that workspaces with more than one upload hourly should not use any data permissions at all. Workspaces where new data is loaded once an hour should use up to 50 unique data permissions (usually fewer than 50 users). These frequently loaded workspaces should be load-balanced across multiple workspace instances.
For more information about filtering data, see Filter Expressions.
MAQL DML: Deleting Records
It is always a good idea to avoid record deletion at the workspace level. Deleting Data from a Workspace shows the techniques that you may consider. Deleting Records from Datasets article shows useful hints for MAQL DML usage. If you need to delete significant amounts of records (more than 5% of all records in a dataset), consider switching the dwh_delete feature flag (contact our support at support@gooddata.com. Note that the dwh_delete feature flag is only applicable to the Postgres workspaces.
Report Export
There are multiple methods to export report data. Use the raw data export option for large data volumes. This report data export option is the fastest and the most performant as it doesn’t perform any pivoting (cross-tabulation). The performance advantage of this option grows with the number of report attributes and metrics.
Report Execution Limits
Below are a few platform limits related to the report execution:
Accessing Platform Limits requires a login to view this page. If you do not have access, you can register via sign-in on the GoodData Support portal.
MAQL
This section describes few useful MAQL performance tips.
Filtering
Always make sure that filtering conditions are set on attributes, not facts. For example, make sure that updater_id in MAQL WHERE condition *updater_id = 123 *is an attribute (not fact). In general, avoid using facts for filtering if possible. The reason for this is that PDM columns corresponding to facts are not indexed (as opposed to the attributes columns) which makes the filtering much less effective.
Unnecessary Nested Metrics Aggregation
Be careful about unnecessary aggregations when reusing (nesting) metrics. The situation below often during metrics reuse in workspaces with multiple analysts.
M1: SELECT SUM(Amount) BY Account
M2: SELECT AVG(M1)
M3: SELECT SUM(M1)
M4: SELECT SUM(Amount)
The M2 computes the average revenue by account. Reusing the M1 in M3 is a bad idea from the performance perspective. Use the simple M4 definition instead.
The SELECT AVG(SELECT SUM(Amount)) or similar MAQL metric usually isn’t what your business users want. You most probably want to use something like SELECT AVG(SELECT SUM(Amount) BY SalesRep) (i.e. an average amount by sales reps) instead.
Unnecessary IFNULL
Here is quite frequent IFNULL pattern that usually happens during metrics reuse:
M1: SELECT SUM(Amount) WHERE Status = ‘New’
M2: SELECT SUM(Amount) WHERE Status = ‘Open’
M3: SELECT IFNULL(M1,0) + IFNULL(M2,0)
M4: SELECT SUM(Amount) WHERE Status IN (‘New’, ‘Open’)
The M3 uses IFNULL to handle situations when the M1 or M2 yield no record for a specific filter. You should use M4 instead of M3.
Avoid using IFNULLs that would operate on possibly large intermediate results. If possible, use IFNULL only in your most outer metrics rather than in inner metrics (unless you know what you are doing).
Unnecessary LIKE
The MAQL LIKE operator execution is slower than standard equality or IN clause. Use usage of the equal or IN operators instead of the LIKE operator wherever it is possible:
M1: SELECT SUM(Amount) WHERE StageName LIKE ‘%Closed%’
M2: SELECT SUM(Amount) WHERE StageName LIKE ‘Closed%’
M3: SELECT SUM(Amount) WHERE IsClosed = 1
The best form is M3 because the underlying database engine can leverage indexing. The M2 is better than M1 because the “begin with” pattern matching is faster than the “pure contains” pattern.
Rolling Window Functions
Use the rolling windows MAQL functions for implementation of running aggregations (e.g. running average) instead of the expanded MAQL expressions. For more details, see Rolling Window.
M1: SELECT ( SELECT SUM(Revenue) FOR PREVIOUS( date, 1 ) + SELECT SUM(Revenue) FOR PREVIOUS( date, 2 ) + … + SELECT SUM(Revenue) FOR PREVIOUS( date, 30 ) ) / 30
M2: SELECT RUNAVG(Revenue ) ROWS BETWEEN 30 PRECEDING AND CURRENT ROW
Dashboard Execution
Dashboards contain many components that perform data retrieval (e.g. reports, filters etc.). This section contains some guidance focused on dashboard performance and interactivity.
Dashboard Design
The ideal dashboard design has an initial state shared by many users. The initial state is cached after the first dashboard execution (after a cache invalidation) and all subsequent executions are very fast (cached). The subsequent states are driven by highly selective filters (the filtered report result < 5% of the total record count in large datasets) that are fast because of indexing (PostgreSQL only). Alternatively, the dashboard uses saved filters (see Using Saved Views Using Saved Views) or data permissions with high selectivity right from the beginning.
Dashboard executes reports in top-down, left-to-right order. Reports are executed in parallel by four reports at the time, all other executions are queued. Reports in the visible part of the dashboard (current tab and currently visible reports) are executed with the highest priority.
Dashboard Structure
It is wise to limit the number of tabs within a dashboard as well as the number of objects on each dashboard’s tab for performance reasons. Here are the most important limits.
Accessing Platform Limits requires a login to view this page. If you do not have access, you can register via sign-in on the GoodData Support portal.
Filter Group
By default dashboard reports are re-executed right after changing any applicable filter value. We recommend using filter groups in situations when user changing multiple filters at the same time. The filter group saves many interim report executions by submitting changes to multiple filters just once using the group’s Apply button.
Dashboard Limits
Below you can find links to the dashboard related platform limits:
Accessing Platform Limits requires a login to view this page. If you do not have access, you can register via sign-in on the GoodData Support portal.