Reporting M-N Metrics by Tag
The following procedure is applicable to XAE versions 1 and 2. It is advised to upgrade XAE to version 3 for improved handlng of M:N. See Many-to-Many in Logical Data Models for more details.
Suppose your worskpace contains data from your company’s help desk. It may include a Tag attribute, which contains the list of possible ticket types. One or more of these ticket types can be assigned to an individual help desk ticket.
- For a ticket, the Ticket Tag field can have multiple values. For example, a ticket’s tags could be customer and printing.
- However, this structure presents challenges in reporting, since there is no way to split any metric value based on each of these tag values.
In this help desk example, all customer-related tickets are tagged with the Ticket Tag value customer. In this case, the report needs to show first response times for customer-related issues. However, in this M:N model, you cannot easily slice a metric related to a ticket by one of several tags associated with the ticket.
If you are not using the Ticket-Tag M:N model, feel free to modify the following steps to meet your workspace’s requirements.
Steps:
Create a metric to tabulate the number of tickets in the Ticket dataset. This metric is a simple COUNT metric of the records in the dataset.
Create a # Tickets w/Customer metric in the Custom Metric Editor to show tickets with the tag customer:
Select # Tickets WHERE Ticket Tag = customer
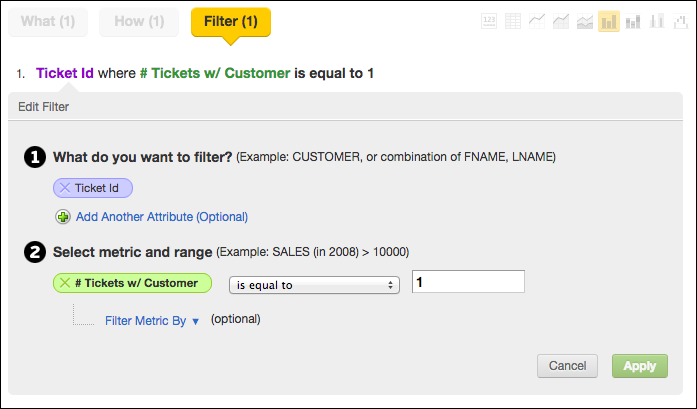
This new metric is not displayed in the report. Instead, it is used to filter the results of the report so that only tickets containing the customer tag are displayed. To enable this kind of report, you must create the following filter on the report itself in the Filter pane:
In the background, this filter matches up tickets with your designated customer tag as defined in your metric. When the filter finds a ticket that matches the criteria, the returned result is 1, and tickets that do not match the filtered criteria yield a 0. So, you must filter your tickets that result in a 1, which is how you know that all tickets shown in the report have the customer tag.Now, you can define the other elements of the report. In the What pane, add any metrics that you would like to filter by Ticket Tag=customer. For example, you might want to measure a First Reply Time metric by customer.
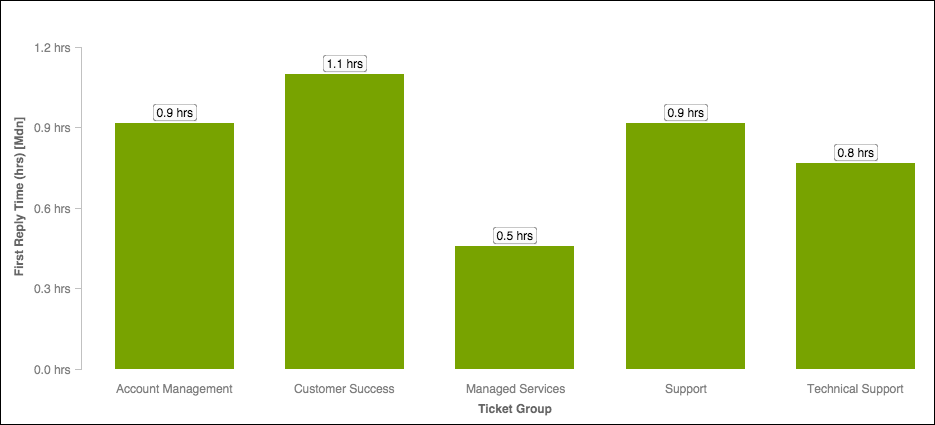
In the How pane, you can apply any attributes by which to slice the metric values. Below, you can see an example report on median First Reply Time for customers, sliced by Ticket Group.
To report on metrics by attribute values in a many-to-many model, you must filter the report by the count of records where the attribute value is present.

