Modeling Many-to-Many Relationships in CloudConnect
This article details modeling M:N relationships for version lower than XAE version 3. See Many-to-Many in Logical Data Models for current M:N modeling methods.
Constructing a good data model is critical to performance and usability of your GoodData workspace. This article provides alternatives and guidance in handling situations involving M:N (many-to-many) relationships. The examples in this article are shown using the CloudConnect Designer application. See the Welcome screen in the Help menu for more details about CloudConnect Designer.
Workspace Scenario
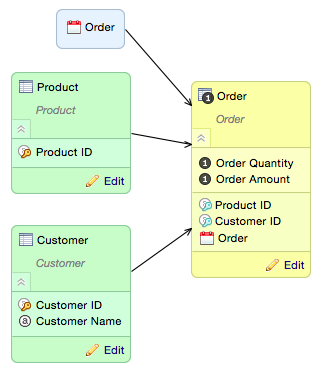
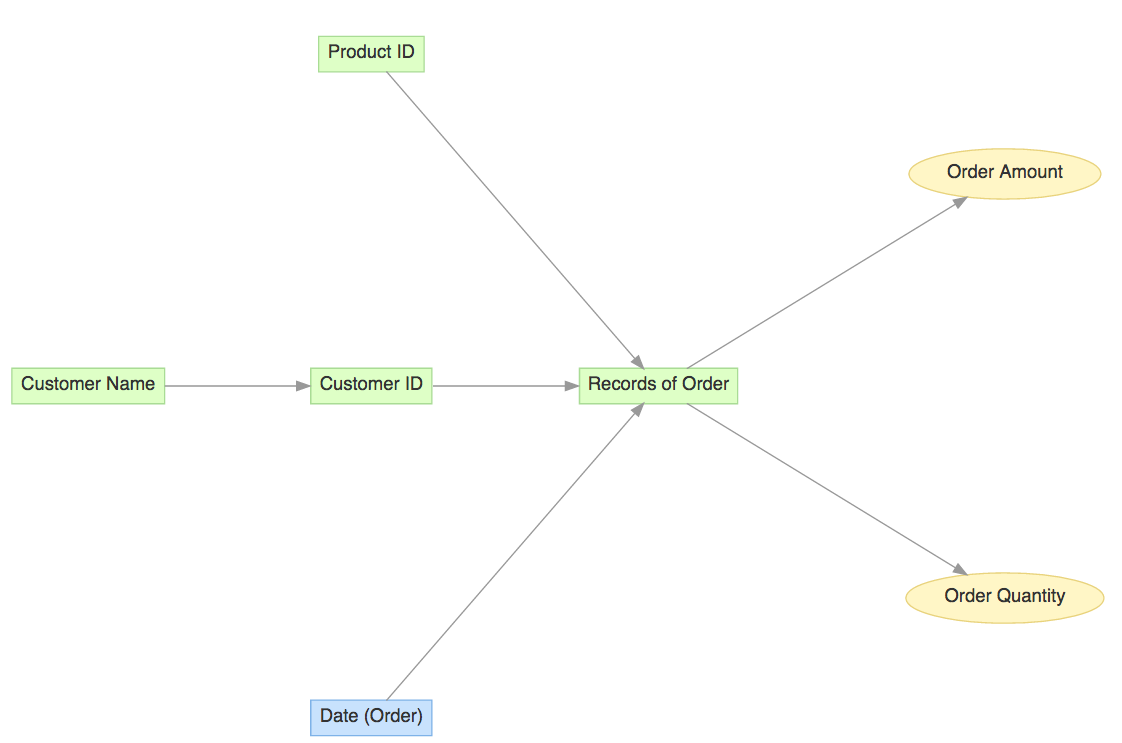
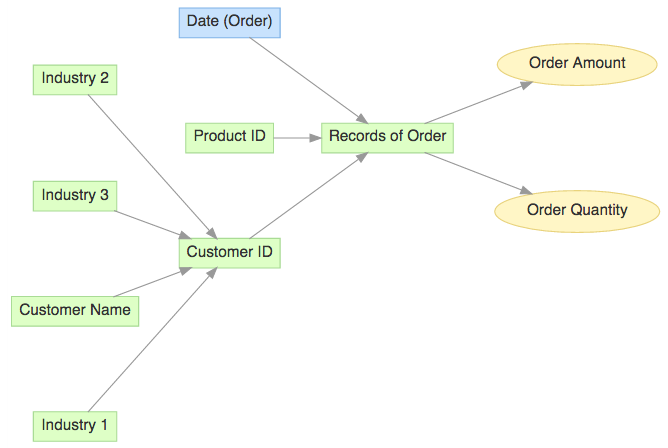
Most data models contain typical 1:N (one-to-many) relationships that are easy to represent using CloudConnect Designer. Here is a simple example, shown in CloudConnect Designer, along with the resulting runtime model after the model is published to the workspace:
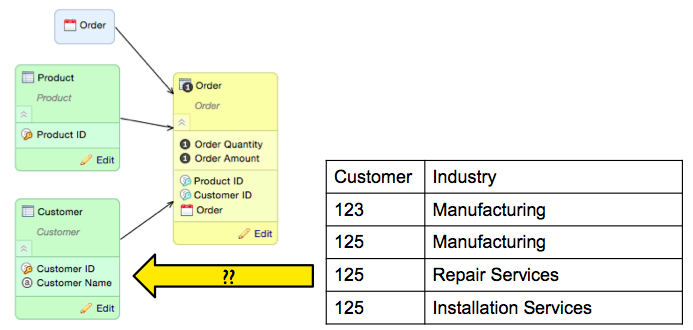
Now, let us add a new requirement: the business users need to be able to slice orders by the industry that the customers are in. However, a customer can be in multiple industries, as illustrated here:
Data Modeling Alternative Solutions
If we create an Industry dimension, the relationship between Industry and Customer must be M:N. If we were to attempt to connect the new Industry dimension to the Order fact dataset, the relationship must also be M:N. In dimensional models, all relationships must be 1:M, so we have a dilemma.
In theory, there are three possible modeling solutions for resolution of M:N relationships. Let’s take a quick look at all three before we dig into the details, including benefits and drawbacks, of each alternative:
- Bridge Attributes: Repeat the attribute(s) in an existing dimension. Basically this adds an array of attributes (Industries in this example) with a fixed number of repetitions.
- Bridge Dimension: Add the new dimension (Industry in this example) and a bridge dimension that resolves the many-to-many relationship.
- Fact at the M:N Grain: Add the new dimension (Industry in this example) and a fact table with a grain at the M:N level of detail (by Customer and Industry in this example).
Bridge Attributes Alternative
This alternative is the simplest of all to model because the only impact to the existing model is to add more attributes to one of the dimensions. Here is an example that shows a maximum of three industries per customer (CloudConnect Designer model on the left and the corresponding runtime model on the right):
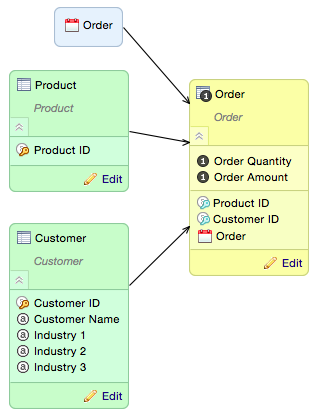
Although this is the simplest of the alternatives, the drawbacks are significant enough that it is seldom a viable alternative. First, you must compromise on the maximum number of repetitions. In this example, that means choosing the maximum number of industries that can be represented for any given customer. Second, any report that needs to slice or filter on the bridge attributes must do the same thing for each of the repetitions. For example, if a filter needs to be added so only customers in Manufacturing are included in a report, the filter must check Industry 1, Industry 2 and Industry 3 and include customers where any one of those attributes matches Manufacturing. Obviously, this will lead to a lot of custom coding in the reporting layer.
Bridge Dimension Alternative
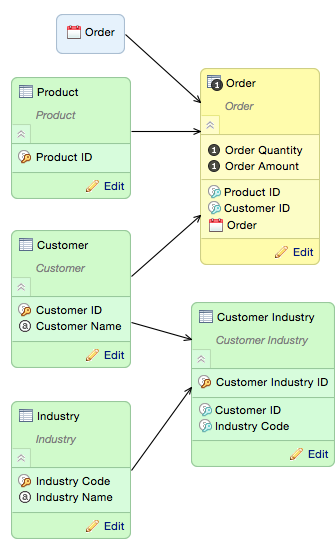
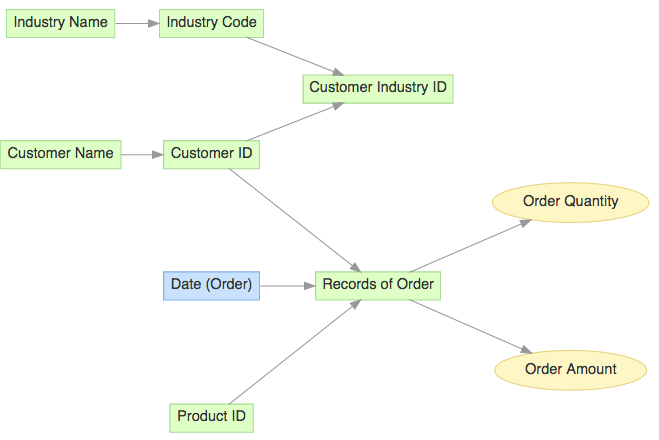
This alternative involves adding a new dimension (Industry) along with what dimensional modelers call a bridge dimension (Customer Industry) to resolve the M:N relationship between Customer and Industry. Here is the data model (CloudConnect Designer model on the left and the corresponding runtime model on the right):
The Industry dimension will contain one row for each industry, while the Customer Industry dimension will contain one row for each valid combination of Customer and Industry (essentially an intersection dataset that resolves the M:N relationship, much as one might do in a more traditional relational data model). As with most dimension datasets, Customer Industry has a connection point – this complies with the CloudConnect Designer rule that datasets which contain no facts must have a connection point defined, and is also consistent with best practices for dimensional model.
The benefit of this approach over the Bridge Attributes alternative we just looked at is that there is no preset limit on the number of industries for a given customer. The obvious downside is that the model is somewhat more complicated, as is using the bridge table so we can slice the facts by Industry. See the “Querying Through Many-to-Many Relationships” section later in this document for more information on how to use the bridge table in reporting.
Fact an the M:N Grain Alternative
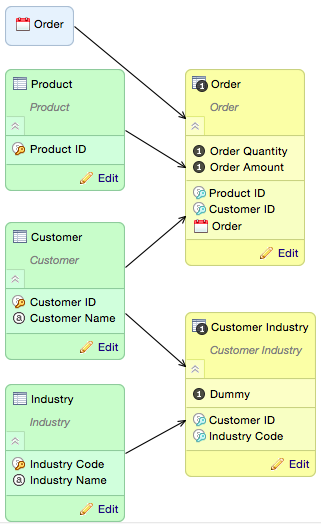
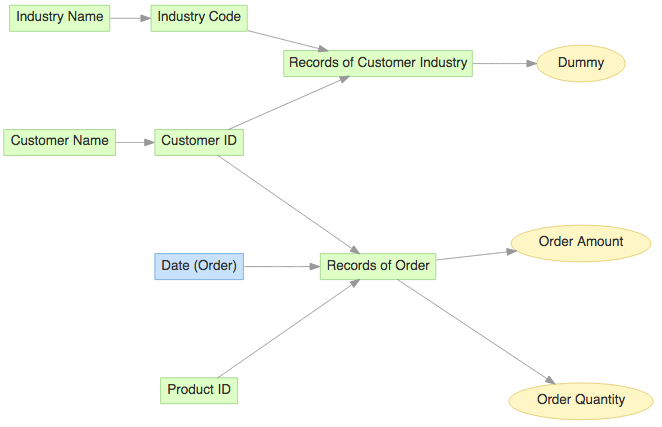
As with the Bridge Dimension alternative, this alternative involves adding a new dimension (Industry). However, instead of adding a bridge dimension (Customer Industry) to resolve the M:N relationship between Customer and Industry, we use a factless fact table. Said another way, if you take the CloudConnect Designer model from the previous example, you can modify it to use this alternative by making two changes to the bridge dimension (Customer Industry): Removing the connection point (Customer Industry ID) and adding a dummy fact (Dummy) in its place. The dummy fact can be populated with the value 1 for every row, essentially allowing metrics that sum the dummy fact as an alternative to counting rows.
The primary benefit of this approach (compared with the Bridge Dimension alternative) is that the model can be more easily changed should real facts at the M:N grain surface later. For example, sometime in the future we might wish to add a fact such as the amount of revenue each customer obtains from each industry with all of their suppliers (assuming the Order fact shows only orders for the organization that owns the GoodData workspace). The primary drawback is that the runtime model, while very similar to the runtime model for the Bridge Dimension alternative, is likely to be somewhat less intuitive for the business user. As you will see in the “Querying Through Many-to-Many Relationships” section later in this document, the use of this alternative in reporting is practically identical to use of the Bridge Dimension alternative.
Here is the data model (CloudConnect Designer model on the left and the corresponding runtime model on the right):
Querying Through Many-to-Many Relationships (using Explicit Lifting)
This section shows you how to query through the many-to-many relationship using Explicit Lifting. This method works equally well for the Bridge Dimension or Fact at the M:N Grain alternatives presented earlier in this document.
For this example, we will summarize the Order Quantity and slice it by Customer Industry. The following reports show the sample data used in the example:
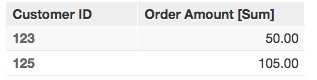
Order Amount by Customer ID:
Customer Industry Combinations
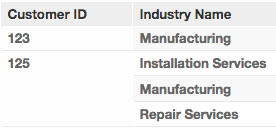
Customer 123 is in only one industry (Manufacturing).
Customer 125 is in three industries (Installation Services, Manufacturing, and Repair Services).
Following is a method for creating a report that slices the Order Quantity by Customer Industry using three steps. Later, we will see how to combine all three steps into a single metric.
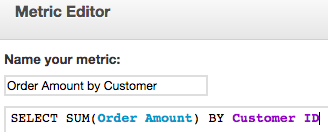
Step 1: Sum the Fact by the Shared Dimension
The first metric (Order Amount by Customer) sums the Order Amount fact and locks aggregation at the Customer level using the MAQL BY clause. A sample report is shown to the right of the metric definition.
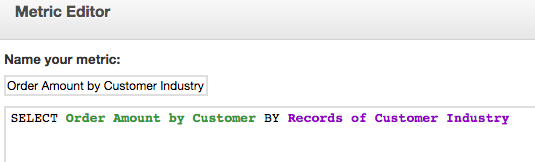
Step 2: Slice the Metric by the M:N Level Connection Point
The second metric (Order Amount by Customer Industry) references the first metric (Order Amount by Customer) and uses the MAQL BY clause to slice by Customer Industry (the dataset that contains the valid Customer - Industry combinations). This example is using the Fact at the M:N Level alternative, so the connection point name is Records of Customer Industry. If you are using the Bridge Dimension alternative, the connection point name will be Customer Industry ID instead of Records of Customer Industry. Here is the metric definition:
You will not be able to slice a report by Industry using this metric, but you will using the metric we create in the next step.
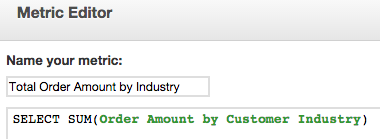
Step 3: Aggregate by the “Many” Attribute
Finally, we take the metric from Step 2 (Order Amount by Customer Industry) and aggregate it by the attribute that has the many-to-many relationship with the fact using in our first metric (Order Amount). In this example, that would be the Industry Name. Here is the metric definition and a report that uses it to slice Order Amount by Customer and Customer Industry:
You probably noticed that the Order Amount for Customer 125 is repeated for each industry. In order to prorate the Order Amount by industry, we would need a fact at the M:N level (in the Customer Industry fact dataset).
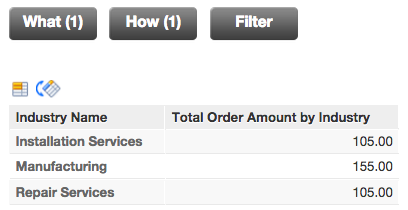
You can also easily create a report that slices only by Industry using the same metric:
Combined Into a Single Metric
The three steps used above are generally easier to follow. However, it can all be done in a single metric using MAQL statement nesting. Nested statements are enclosed in a set of double parentheses. Here is the same metric we developed in three parts, but now combined into a single metric:
