Snapshot Dimensions
CloudConnect is a legacy tool and will be discontinued. We recommend that to prepare your data you use the GoodData data pipeline as described in Data Preparation and Distribution. For data modeling, see Data Modeling in GoodData to learn how to work with Logical Data Modeler.
Date dimensions allow you to associate a metric’s underlying facts with certain events, such as the date an opportunity was created. You can also take snapshots of data at predefined intervals, such as at the end of each day or business week. Snapshots are useful for showing the current value of a metric, how a metric value fluctuates over time, or how the current value of a metric compares with an earlier value of the same metric.
How an enterprise implements and manages snapshots, and the intervals at which snapshots are taken, depends on the particular project in question and the organization’s unique needs. It is common for companies to purge fine-grained snapshots taken in the distant past, and to retain larger-grain snapshots (like week, month, or quarter) for historical comparison, but this too depends on the needs of the particular organization.
Additionally, snapshots include only a subset of project facts. In order to use date dimensions effectively, you should be familiar with your project’s data and logical data model. See Dates and Times.
Unlike other date dimensions whose attributes often appear along the axes of reports, snapshot date dimensions usually form part of a metric’s definition and are not standalone attributes in report definitions.
For example, the chart below shows a sales pipeline in which deal amounts are broken down by stage for two snapshot dates. By including a snapshot filter within the metric, we can create a visualization that shows how the status of the pipeline at the start of the period (gray area) compares to the current status of the pipeline (red area).
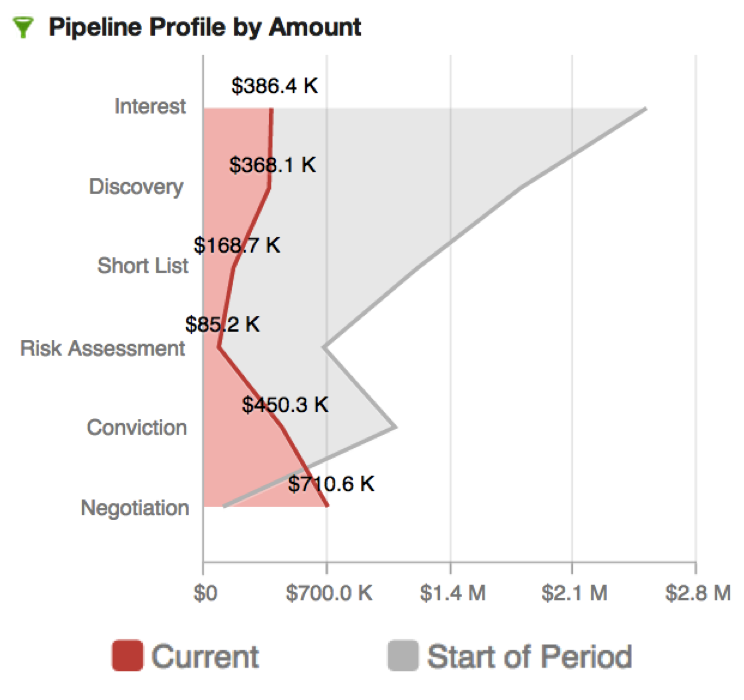
Filtering for a Snapshot Date within a Metric
Beyond allowing you to peer into the past, snapshots also allow you to approximate the current value of a constantly fluctuating or estimated metric.
For example, suppose a sales organization wants to track its progress towards reaching a quarterly quota. They can do this by defining a metric that returns an up-to-date estimate of the earnings that are expected by quarter’s end. Because the estimate is captured by the most recent snapshot of the data, the metric must include a filtering statement to pinpoint the most recent snapshot date.

SELECT SUM(Amount * Probability) WHERE Snapshot(Date) = Snapshot[EOP] and Status in (Open, Won)
Chronological dates are assigned a numerical identifier. The later (more recent) a date is chronologically, the larger the numerical value it is assigned. (For example, November 17, 2014 corresponds to a larger numerical identifier than November 16, 2014.) So, to pinpoint the largest (most recent) snapshot date, the sales organization defines its Snapshot [EOP] metric as follows:
SELECT MAX(SELECT Snapshot(Date) BY <connection_point>) BY ALL OTHER EXCEPT Snapshot(Date) WITHOUT PF
The <connection_point> above is an attribute or set of attributes that uniquely identify the records of a data set (for example, Records of Snapshots).
Creating a separate Snapshot [EOP] metric allows you to add additional MAQL syntax in the future to handle more complex use cases and report types without the need to add complexity to the Expected + Won metric. And if it has been defined as a global metric, Snapshot [EOP] can be reused in filter clauses in other project metrics.