Painless Disconnected Date Dimensions
CloudConnect is a legacy tool and will be discontinued. We recommend that to prepare your data you use the GoodData data pipeline as described in Data Preparation and Distribution. For data modeling, see Data Modeling in GoodData to learn how to work with Logical Data Modeler.
The disconnected date dimension (DDD) is an extremely useful tool for using a single dashboard date filter to control multiple reports that have different date dimensions, and for advanced calculations such as comparison between a current and (variable-length) previous period. This post further discusses such techniques.
If you’re new to disconnected date dimensions, start by checking out our introductory article on the subject Flexible Querying with a Disconnected Date Dimension.
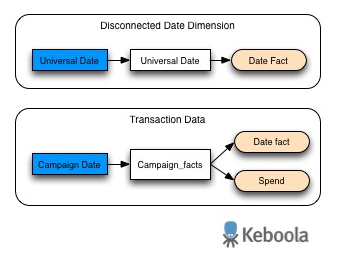
To begin our discussion of DDDs, take for example a table called “campaign_facts” that has the amount spent for each campaign for each day. Let’s start by focusing on two columns in that dataset – a “spend” fact and a “Campaign_Date” date dimension.
An associated report could have a metric such as Spend (Total), defined below, that is based off of the spend fact.
Spend (Total):
SELECT SUM( spend (campaign_facts) )
This metric could then be sliced and filtered by a Campaign_Date date attribute.
Now, let’s say I have a DDD in the project, called “Universal Date” and that we’ve already defined the usual _BOP (Beginning of Period) and _EOP (End of Period) metrics for that dimension in the following way:
_BOP:
SELECT MIN( Date (Universal Date) )
BY ALL OTHER EXCEPT Date (Universal Date)
_EOP:
SELECT MAX( Date (Universal Date) )
BY ALL OTHER EXCEPT Date (Universal Date)
For your reference, here’s a simplified sketch of the associated model:
If I want to use the Spend (Total) metric in a report that will adhere to a disconnected dimension dashboard date filter, the standard procedure is to add a filtering statement to the metric’s definition. Here’s what our new metric, Spend (Total) by Universal Date, might look like:
Spend (Total) by Universal Date: SELECT Spend (Total)
WHERE Date (Campaign_Date) BETWEEN _BOP AND _EOP
This type of filter would then be added to every metric that should adhere to the DDD filter. But there’s a better way to do this.
A Better Way to Work with Disconnected Date Dimension Filters
Our workaround will involve building a new system metric for each date dimension in our model that we’ll be able to use in reports that should adhere to the DDD filter. This metric could be defined as follows for a Campaign_Date dimension:
_filter Campaign_date by Universal Date:
SELECT COUNT( Date (Campaign_Date) ) BY Date (Campaign_Date),
ALL OTHER WHERE Date (Campaign_Date) BETWEEN _BOP AND _EOP
This metric returns “1” for each Campaign_Date that falls into the interval defined by the disconnected date dimension filter, and “null” otherwise.
Now, for any report that is to adhere to the DDD, add a report-level numeric range filter that will serve to include only those values for which our system metric’s value is greater than zero.
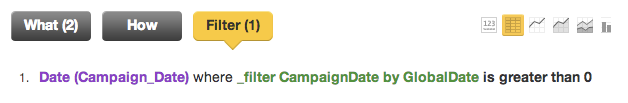
Our report-level numeric range filter will work exactly the same way as a normal date range filter would, and no modifications of metrics inside the actual report are required. It’s that simple!
Using the numeric range filter paired with this type of system metric opens many new possibilities – this is just one of them.