Modeling Technique - Pushing FACTs Down the Hierarchy
CloudConnect is a legacy tool and will be discontinued. We recommend that to prepare your data you use the GoodData data pipeline as described in Data Preparation and Distribution. For data modeling, see Data Modeling in GoodData to learn how to work with Logical Data Modeler.
This article shows a special data modeling trick that leads to simpler and more usable data models. This technique is applicable to data models that perform computations on facts in different datasets. The example demonstrates the technique on a simple data model.
We need to combine the Quarterly Bonus and the Payment facts into a single report. One option is to follow the M:N modeling technique. This technique is suitable for situations when we cannot change the data model of the project. The option that we introduce in this article require the project’s data model change. However, it leads to more usable metrics and overall better performance.
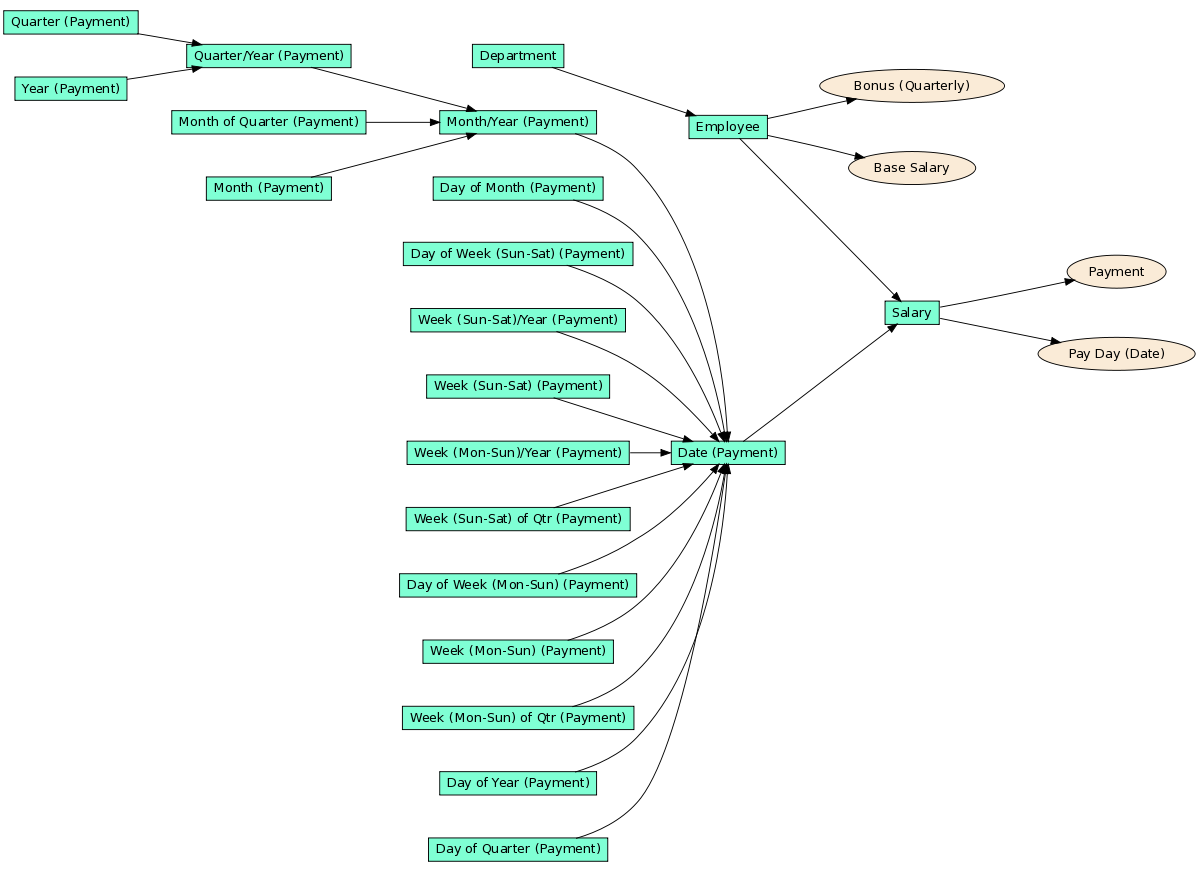
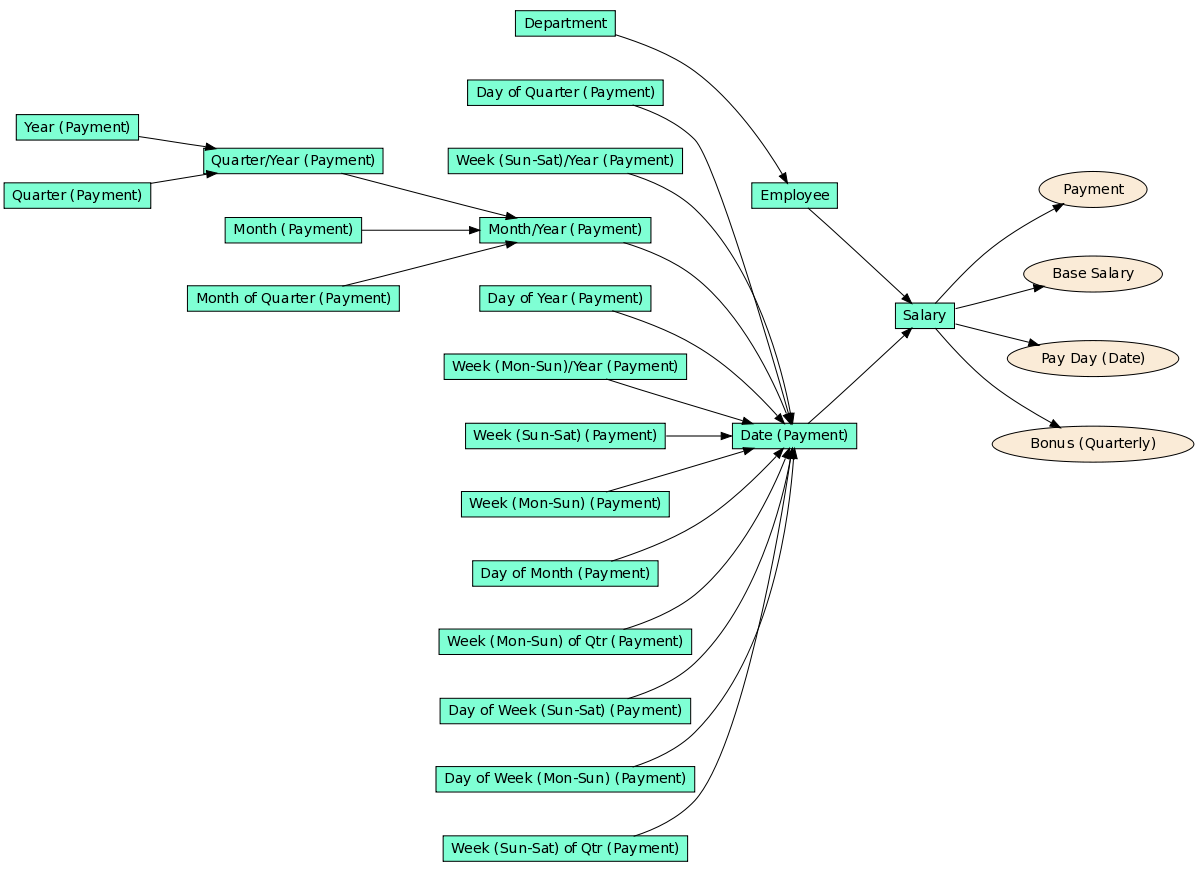
The first step is that we need to push the Employee dataset’s facts to the Salary dataset. Here is the new model:
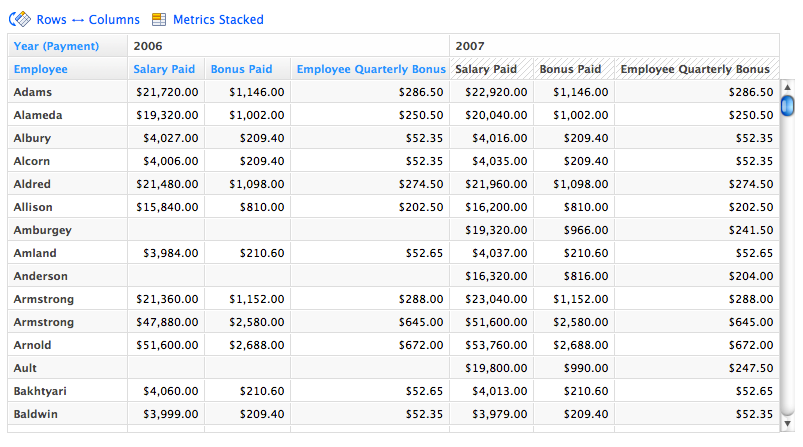
Let me emphasize that there are 205 employee records and 3876 salary records in my test data. This means that the 205 different Quarterly Bonus values are somewhat duplicated (de-normalized) in the 3876 salary records. We need to handle the duplicates in our metrics definitions. Here are the metrics:
Salary Paid :
SELECT SUM(Payment)Employee Quarterly Bonus :
SELECT MIN(Bonus (Quarterly)) BY Employee, Quarter/Year (Payment)ALL IN ALL OTHER DIMENSIONSBonus Paid :
SELECT SUM(Employee Quarterly Bonus)
The MIN aggregation in the Employee Quarterly Bonus metric converts all duplicate Quarterly Bonus values to a single value per Employee and Quarter. As all these values should be the same, we could also use the MAX or AVG aggregation.
Here is the report with all metrics computed on our test data: