HR Data Analysis
CloudConnect is a legacy tool and will be discontinued. We recommend that to prepare your data you use the GoodData data pipeline as described in Data Preparation and Distribution. For data modeling, see Data Modeling in GoodData to learn how to work with Logical Data Modeler.
In this example, you download the HR Demo project and import it into CloudConnect. This simple project reads HR data from a CSV file and loads it into the predefined datasets in the GoodData project using the GD Dataset Writer component.
Pre-Requisites
CloudConnect Designer. For more information, see the Downloads page at https://secure.gooddata.com/downloads.html.
If you are a white-labeled customer, log in to the Downloads page from your white-labeled domain:https://my.domain.com/downloads.html.GoodData Account. For more information, please contact GoodData Customer Support.
Getting Started with the Project
To begin, download the HR Data Analysis demo package, which is stored as a ZIP file.
Open CloudConnect Designer. From the menu, select File > Import. Import the project from the archive (ZIP) file as a CloudConnect project.
The package contains the following:
- model: hrdemoldm.ldm
- graph: hr.grf
For each CloudConnect project, you must assign a GoodData working project. To assign, click the Server Explorer tab, and then click the GD logo:
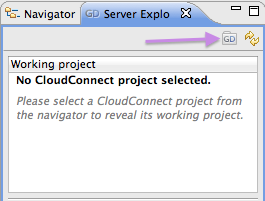
The Create GoodData Project window is displayed. Enter a Project Name and provide a project authorization token. Then, click OK.
For more information about the project authorization token, see Find the Workspace Authorization Token.
Reviewing the Logical Data Model
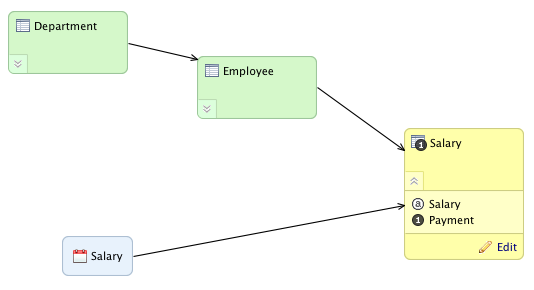
In CloudConnect, click the Project Browser tab, and open model/hrdemoldm.ldm, which contains the logical data model. In GoodData, the logical data model is used to 1) define how the incoming ETL data is stored in the project datastore and 2) assist in handling queries submitted from the GoodData Portal.
The base dataset is Salary, which contains the Payment fact. It’s yellow in the diagram below.
There are two other datasets, Employee and Department, which form a hierarchy of information related to the transactions recorded in Salary. To connect these datasets, you must configure the connection points to the Department and the Employee datasets, and then drag the arrow to connect them together.
To connect two datasets, click the edge of the reference dataset and drag the forming arrow to the side of the referencing dataset. For example, click the right side of the Employee dataset and drag it to the left side of the Salary dataset.
A reference field (foreign key) is added automatically and is not visible in dataset’s attribute list. In effect, the edge/arrow between datasets represents the Reference field.
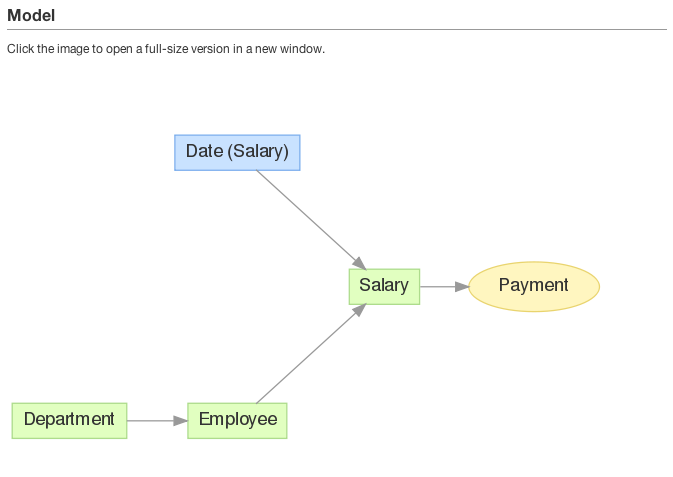
To publish the model, click Publish model to server in the Details sidebar. In a few seconds, the model is published to the GoodData project. You can review a graphical representation of the model in your GoodData project. In the menu, select Manage > Model.
ETL Graph
In CloudConnect Designer, you build ETL graphs to extract, transform, and load data into the GoodData project. An ETL graph contains visual representations of the sequence of activities applied to the data stream, as it is pulled from one data source, transformed in zero or more ways, and loaded into the selected GoodData project.
To review the ETL graph in the HR example, open the graph/hr.grf file in the Project Explorer tab:
In the above image are three different ETL graphs, each of which pulls data using the UniversalDataReader from a separate CSV file: department.csv, employee.csv, and salary.csv.
This data is immediately passed to the GD Dataset Writer components. The data stream is represented by the arrows connecting components, which are called edges. Within each edge, you can map or manually specify the fields that are passed between components. These field mappings are called metadata.
To specify the metadata, double-click the arrow connecting two components.
Specifying a Working Project
You can now specify the working project for your ETL graph. This value may already be specified if you have already defined the working project for your logical data model. To specify the working project, you may make updates in one of the following ways:
- Click the Server Explorer tab. Secondary-click the project to which you wish to publish your ETL. Then, select Set as Working Project.
- The working project can also be specified directly through the workspace.prm file.
- It is also possible to specify separate working projects in each GD Dataset Writer, although this use case is rare.
If your working project is correct, you are ready to Run the Graph locally.
- To run the graph locally, secondary-click in the white space in the ETL graph, select Run Graph Locally. The ETL graph is executed locally, and the data is written to the selected GoodData project.
- If debugging has been enabled in the edges between components, you should see counts of the number of records passed across each edge.
In the GoodData Portal, verify that all data has been processed correctly into the selected project.