Flexible Querying with a Disconnected Date Dimension
CloudConnect is a legacy tool and will be discontinued. We recommend that to prepare your data you use the GoodData data pipeline as described in Data Preparation and Distribution. For data modeling, see Data Modeling in GoodData to learn how to work with Logical Data Modeler.
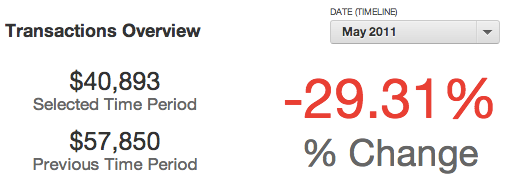
This article will help you with creating dashboards like the following example:

The requirements are as follows:
- The Selected Time Period report shows a metric filtered by dashboard filter (e.g. May 2011)
- The Previous Time Period report shows a metric filtered to the previous period of the same length (e.g. the previous 31 days in case of May 2011)
- These reports continue to display parallel time periods, even if you select a period of a different length in the dashboard filter (e.g two months or even an arbitrary start and end date)
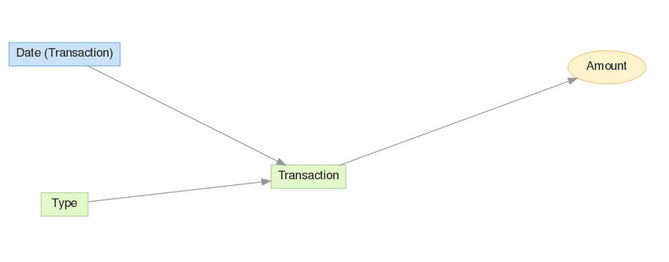
Let’s use the following simple data model:
The Problem
If the Date filter is based on the Date (Transaction) date dimension, it automatically filters all reports on the dashboard, unless you explicitly override this behavior using the green funnel icon.
This works fine for the Selected Time Period report. However, the same dashboard date filter is also applied to the Previous Time Period report.
Disabling the date filter for the Previous Time Period report does not work. If the report does not know the selected period, then it cannot compute what the previous period should be.
Therefore, the solution must provide the following:
- The date filter affects the selected time period report.
- The previous time period report can access the selected period, but it won’t be directly filtered.
Using the BY ALL OTHER Statement
The BY ALL OTHER statement (or its longer equivalent BY ALL IN ALL OTHER DIMENSIONS) computes a metric total and shows it for any slices. Even attributes that are completely disconnected from the data sets can be used for slicing.
If you are not familiar with BY ALL OTHER, you should review a great blog post about various BY clauses after you finish reading this article.
Suppose you spend $1000 every month and you have uploaded one year of your expenses into GoodData. A report on this data might look like the following:
| Month | SELECT SUM(Expense) | SELECT SUM(Expense) BY ALL OTHER |
|---|---|---|
| January | $1,000 | $12,000 |
| February | $1,000 | $12,000 |
| March | $1,000 | $12,000 |
| … | … | … |
Solution: A Disconnected Date Dimension
We create a completely separated date dimension, let’s call that date dimension “Timeline”.
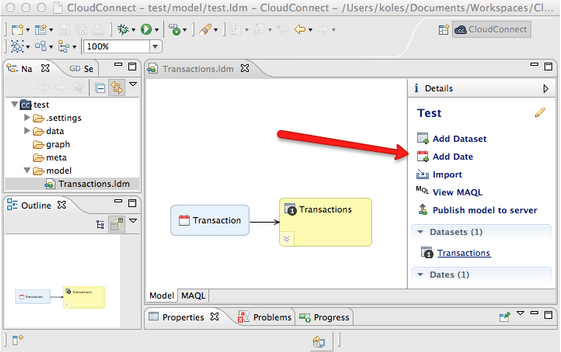
You can do that easily using the CloudConnect LDM modeling UI by clicking the “Add Date” link in the right menu and publishing changes to the server:
… or by pasting the following MAQL DDL code to the text field at the https://secure.gooddata.com/gdc/md//ldm/manage gray page:
INCLUDE TEMPLATE "URN:GOODDATA:DATE"
   MODIFY (IDENTIFIER "timeline", TITLE "Timeline");
After you add the new date dimension to your project your updated data model will look like this:
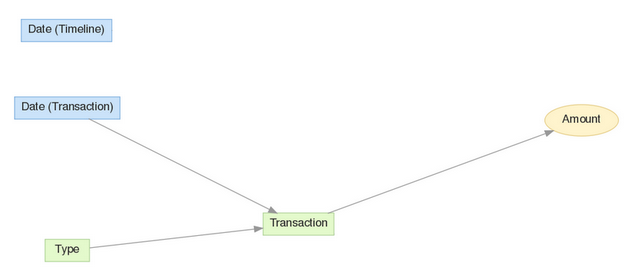
(this is why we call it a disconnected date dimension).
Now, we change our dashboard a bit - we make the dashboard date filter be based on the disconnected date dimension (named Date (Timeline) in our updated model):
We are not there yet. However, there is something interesting about this dashboard: even though no report is excluded from being filtered by the date filter, the date filter actually does not affect any report. This is because it’s based on a dimension that is not connected to data sets behind these reports.
However, we need to propagate the information about the date period specified by the date filter into our metric in a custom way. This is why we will need the following two simple metrics:
Timeline Start:
SELECT MIN(Date (Timeline)) BY ALL OTHER EXCEPT Date (Timeline)Timeline End:
SELECT MAX(Date (Timeline)) BY ALL OTHER EXCEPT Date (Timeline)
The BY ALL OTHER clause ensures that the metrics are never sliced and that they always compute only a single number: the maximal or minimal date value within the filtered period.
Note that Date (Timeline) is an attribute. In the XAE engine, dates can be configured to be attributes (for details, see XAE - Extensible Analytics Engine).
These two metrics are affected by the Date (Timeline) dashboard filter, and they also work together with any other report or metric. They will always compute the smallest and the largest dates representing the boundaries of the filtered period.
These two metrics and the disconnected date dimension deliver complete control on how a dashboard date filter affects the reports.
The downside is that we must update all metrics and specify explicitly how the dashboard date filter should be applied:
Period length:
SELECT Timeline End-Timeline StartSelected time period:
SELECT Sum (Amount) WHERE Date (Transaction) BETWEEN Timeline Start AND Timeline EndPrevious time period:
SELECT Sum (Amount) WHERE Date (Transaction)
BETWEEN (Timeline Start - (Timeline End - Timeline Start +1) AND Timeline Start
Note some older data models may include a so called “date fact”, named as Transaction at (Date) and displayed using a blue font in the metric editor. For performance reasons, it is important to use the date attribute such as Date (Transaction) (purple) rather than the date fact (e.g. Transaction at (Date)) in the WHERE clause.
The use of Date facts is considered a legacy method of managing Date data. It is recommended that you rely on the proprietary Date dimension provided by GoodData, which includes multiple capabilities beyond what is possible with fact-based dates. This documentation is retained in case you are reviewing a project that is still using date facts. Do not create them in new projects.
The difference is that the date fact field is not indexed in the underlying database while the date attribute is. Consequently, the date attribute based filtering may be faster by the order of magnitude if the date filter selects less than 5% of a huge data set and comparable if the date filter selects a significant part of the data set.
This is because the comparison using the date attribute results in a comparison using an indexed column on a relatively small table in the underlying database, while the date fact is defined on a fact table which is usually far larger, and the fact column is not indexed.
This is actually a more general rule - whenever you are filtering by date, either when using the disconnected date dimension or for any other reason, always try to filter by date attributes instead of date facts as filters on date attributes will translate to far more effective queries.