Building an LDM for Facebook Example Project
CloudConnect is a legacy tool and will be discontinued. We recommend that to prepare your data you use the GoodData data pipeline as described in Data Preparation and Distribution. For data modeling, see Data Modeling in GoodData to learn how to work with Logical Data Modeler.
This tutorial shows you how to build a Logical Data Model (LDM) for a Facebook example project.
Before you begin, ensure that you have downloaded, installed, and modified the example CloudConnect project for Facebook. For more information, see Analyzing Data from Facebook Insights.
At this point, you’ve completed the configuration to export Facebook content and to deliver it to a local file. Now, you can build the simple logical data model to enable integration of this data into a CloudConnect Portal.
More generally, this tutorial can be used to learn how to redirect the output from an ETL graph that writes a local file to write the output data to a project in the GoodData platform. As part of this process, you must create or modify the logical data model to support the ETL graph.
Creating a new blank model file
In CloudConnect Designer, logical data models are created in the LDM Modeler, an integrated component of the application. When the logical data model is completed, you can publish it to any CloudConnect project or to create a new project in which to publish it, directly from the CloudConnect Designer interface.
For more information, see Data Modeling Using the CloudConnect Tool.
Steps:
- In the Project Explorer, secondary-click the Facebook Demo project and select New > Other….
- In the Wizard, open the CloudConnect folder. Click Logical Data Model. Then, click Next.
- In the New Logical Data Model screen, you specify the location and filename of the new logical data model file that you are creating.
- Navigate your CloudConnect projects to select the file where you wish to store the model. Typically, the file is written to the
modelfolder inside the project, but it is not required. - For the Title, enter the filename root for the file. The extension
.ldmis automatically appended to the entry. - To create the file, click Finish.
- A blank LDM tab is opened in your project.
Creating the model
You are now ready to begin creating the logical data model. With the knowledge of the incoming data, you can look at the exported CSV file to determine the data that is being written by the ETL graph. You must then build your logical data model to match the fields in the ETL graph.
Steps:
- In the Facebook Demo project in CloudConnect, navigate to the following folder:
/data/gooddata/page_stories.csv. Double-click this file to open it. - In the file, the data should look like the following:
name, stories“page_stories”,”998.0” - In the above, you can see two fields of data:
nameandstories. The ETL process writes one value to each field.- The value for
nameis a text string. - The value for
storiesis a decimal value.
- The value for
- Close the file.
- In the blank LDM Modeler tab, click the Add Data link in the Details sidebar on the right-side of the screen. A new dataset object is added to the LDM Modeler. In the textbox, enter the value Page Stories.
- Click the down arrows on the left side of the Page Stories dataset. It should look like the following:
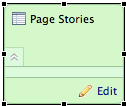
- Inside the dataset, click the Edit link. The Attributes and Facts window is displayed. Here, you define the attributes (text-based and limited numerical data with which to slice your reports) and facts (numerical data with which to build aggregating metrics) for the dataset.
- Select the Show identifier and Show Datatypes checkboxes. The following screenshot shows an example of the screen:
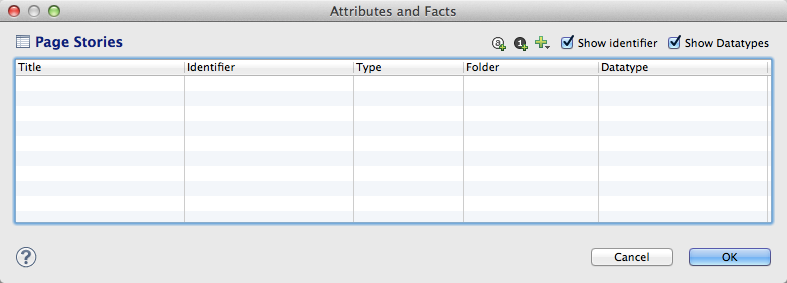
- Now, you need to add the two fields that are present in the generated data.
- To add attributes, click the A icon.
- To add facts, click the 1 icon.
- To add the name field, click the A icon. Enter the value name for the Title. Later, this name must be matched up to the data generated by the ETL graph, so it is important to match it up as closely as possible to the field name.
- (Optional) You may leave the default values for the other columns untouched.
- Click the 1 icon to add the
storiesfield. Enter the valuestoriesfor the Title. - The other column values are fine, except for the Datatype field. For this field, the default configuration displays data as a decimal value, but it includes two decimal points of precision. Since the number of stories is a whole number value, the datatype should be changed.
- Select the field. Then, select the Browse button.
- In the Select datatype window, the Decimal button should be selected. Click the D value. Enter a value of
0. The screen should look like the following:
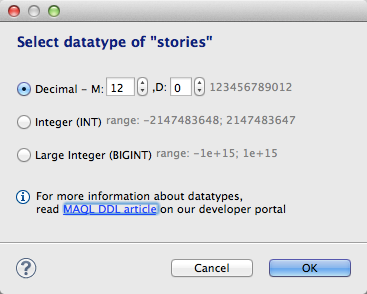
- Click OK.
- The following screenshot shows an example of the Attributes and Facts window:
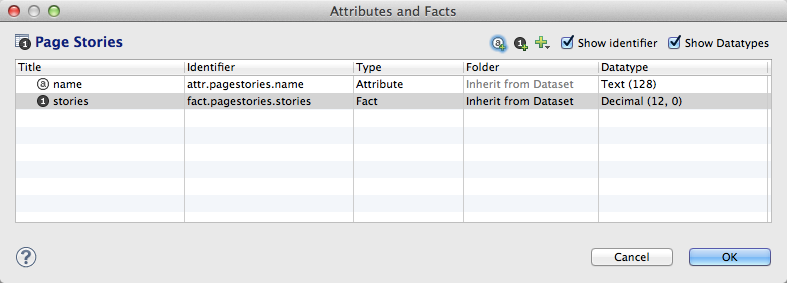
- Click OK. The dataset should now be yellow, since it contains both attributes and facts.
- From the CloudConnect menu, select File > Save.
Publishing the project to the GoodData platform
You have now created the logical data model for the project. Now, you must publish it to the GoodData project in use.
To verify the current working project, click the Server Explorer tab in CloudConnect Designer. The current working project is marked with a green folder icon:
The saved model should now be published to the working project.
Steps:
- In the LDM Modeler tab, click somewhere in the white space. The Details sidebar pane is updated to show new items.
- In the Details sidebar, click Publish model to server.
- In the window, select the project to which you wish to publish the logical data model. If the project doesn’t exist yet, click Create link and enter the title and your project authorization token.
- The logical data model is published to the GoodData working project.
Integrating the model with the ETL graph
Now, you must change the ETL process, so that it writes to this logical data model, which is used by the CloudConnect project to which it was published.
Steps:
- After the model has been published, click the
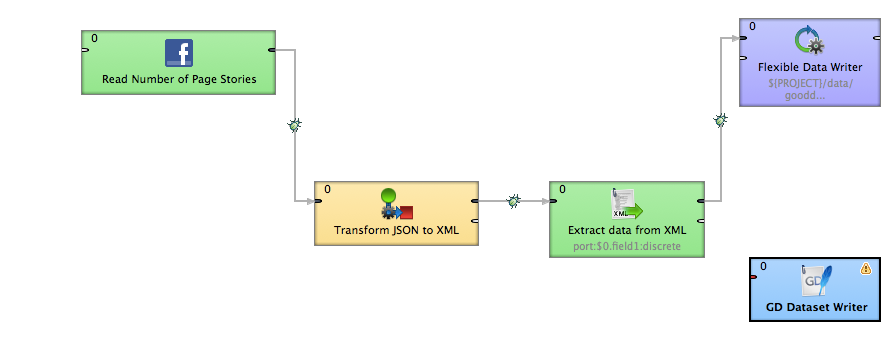
transform.grftab in CloudConnect Designer. The ETL graph is displayed. - The graph is configured to write to a local file using the Flexible Data Writer component. This component needs to be replaced to write to the GD Dataset Writer, which, in turn, writes the data through the logical data model to the current working project.
- From the Palette on the right side of the screen, expand the Writers section. Click and drag the GD Dataset Writer component into the white space of the ETL area. The ETL graph should now look like the following:
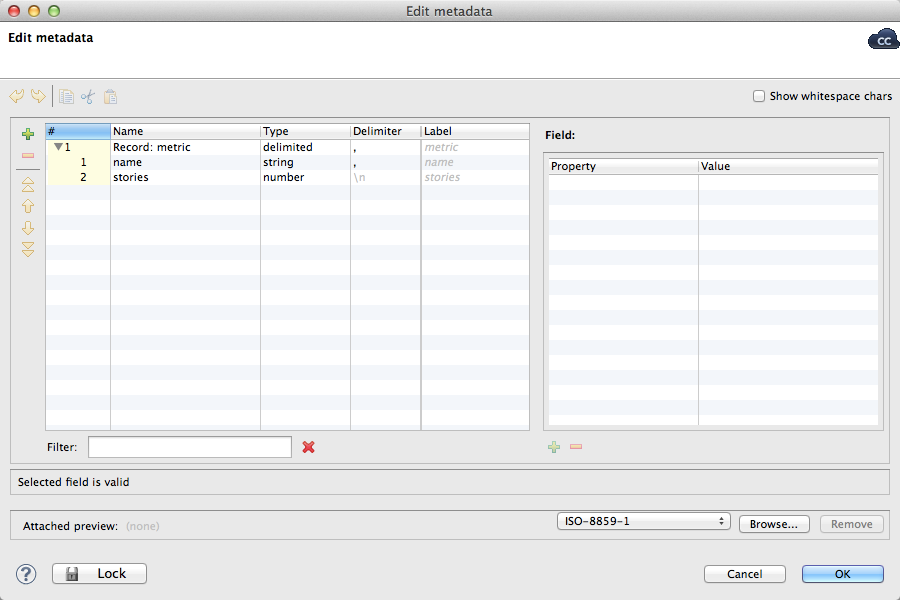
- This new object needs to be integrated and mapped to the fields in existing ETL process. To understand the current mapping, double-click the line connecting the Extract Data from XML component and the Flexible Data Writer component.
- The Edit metadata window is displayed. Use this window to define the metadata, which are the fields that are passed from one component to another in the ETL graph. In this case, the metadata should look like the following:
- Now, secondary-click the line between the two components and select Delete.
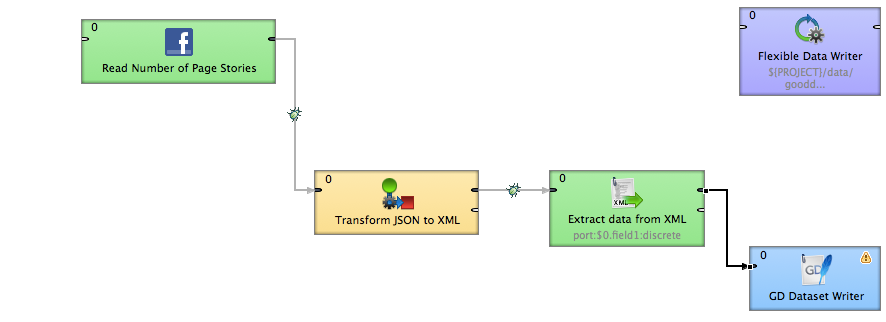
- Click the red port on the right side of the Extract data from XML component. Then, drag the end of the arrow and drag it to the red port on the left side of the GD Dataset Writer.
- When the connection is made, from the displayed menu, select Select Metadata > metric (id:Metadata3). This cryptic value means that you are selecting the metadata from the third metadata set, which is coming from the Extract data from XML component.
- The ETL graph should look like the following:
- Whenever you are adding new elements to an ETL process, enable debugging between components. When debugging is enabled, you can review the counts and individual records that are being passed between ETL components. To enable debugging before the GD Dataset Writer component, secondary-click the line pointing to it and select Enable debugging.
- You may have noticed an exclamation point icon in the GD Dataset Writer component, which indicates that additional configuration is required. Double-click the component: In the above dialog, note that Data set and Field mapping values need to be specified.
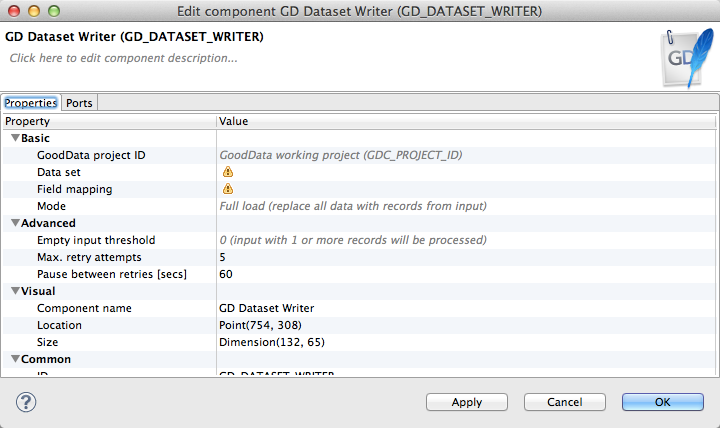
- Click the Data set parameter. In the Choose a dataset window, select the Page Stories dataset. Then, click OK.
- In the GD Dataset Writer properties, click the Field mapping field. Then, click the Browse button.
- In the Dataset field mapping window, you review and modify the dataset field mappings. In this case, the attribute
namemay already be auto-mapped.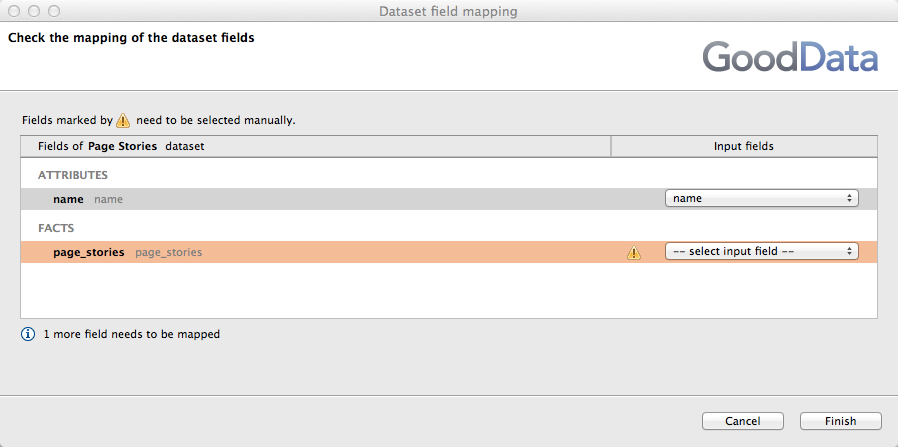
- You may need to map the
page_storiesfact to the appropriate input field from the metadata coming to the GD Dataset Writer component. Selectstoriesfrom the drop-down. Then, click Finish. - Click OK again. There should be no more error icon in the GD Dataset Writer component.
Run the graph locally
You have now completed the integration of the ETL graph with a GoodData project on the platform, using a newly created logical data model to write the ETL data into the project.
To populate the GoodData project with data, you can run the graph locally. Secondary-click the white space in the graph tab and select Run As… > 1 Graph (Locally).
A success message in the Console tab will tell you that the ETL graph executed properly.
You should now check the project in the GoodData platform to verify that the data was loaded properly. Login using your GoodData credentials to: https://secure.gooddata.com.
Summary
Through this simple project, you were able to experience the following aspects of development:
- Configure a connection to use for integrating your CloudConnect ETL graph with a web-based data source.
- Modify aspects of the ETL graph to meet your specific needs.
- Build and publish a simple logical data model to support the ETL graph.
- Execute the graph locally to publish the data to the CloudConnect project using the logical data model to store the data.
Feel free to extend this project to support other types of Facebook queries, using the Facebook Query Language.