You are viewing our older product's guide. Click here for the documentation of GoodData Cloud, our latest and most advanced product.
Displaying Multiple Metrics in Separate Rows or in Separate Columns
When displaying multiple metrics in the same table you can use the Metric Pivot button to toggle between displaying metric values side by side (same row, different columns) or one atop the other (same column, different rows) as is the case in the following example.
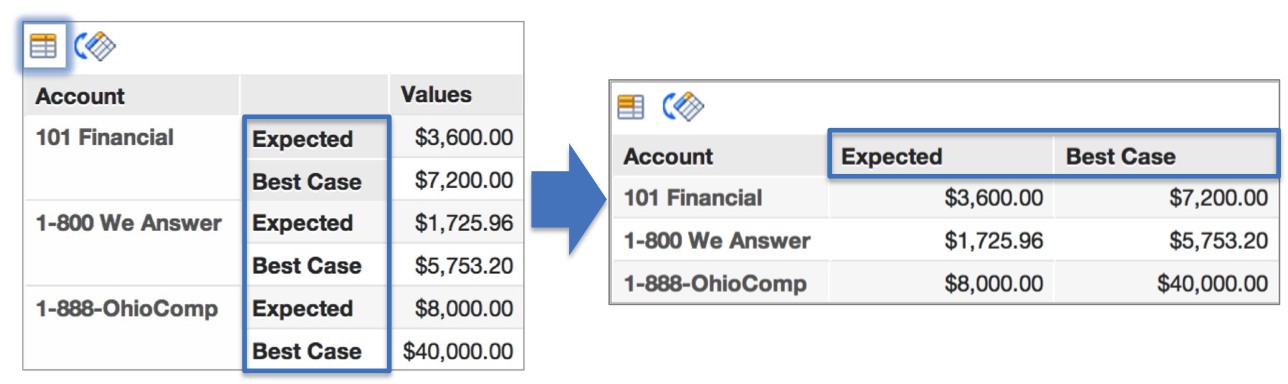
Clicking the Metric Pivot button again restores the table to the original format.