Create a Heat Map Table
This tutorial provides information on how to create a ticket creation heat map, although it can be easily adapted for use with a count of occurrences and the associated timestamp of the event.
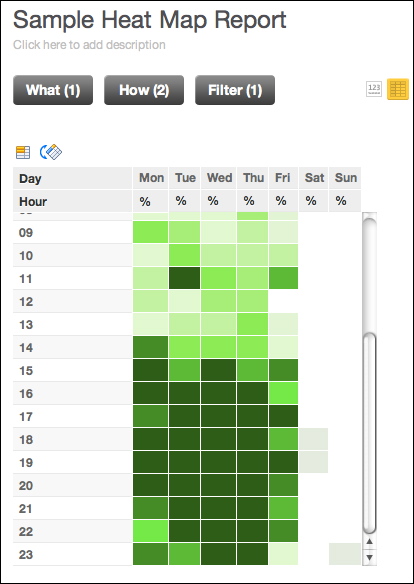
In the image below, you can see a ticket creation heat map, in which the times when support tickets are created are tracked throughout the week, which can assist in addressing staffing needs and scheduling:
Prerequisites
Before you begin, you should verify that the hour of the event that you are tracking is available in your dataset as an attribute, and that it is connected to the metric you are counting. This information is not available by default using the provided Date dimension.
You may need to modify your dataset to capture the hour of the day when the event occurred by parsing an event timestamp or other related value. This value must be captured in an attribute in the data model, and it must be connected to the metric that counts the event instances. For purposes of this tutorial, this attribute is called the Hour attribute.
Steps:
These steps below describe how to create the Ticket Creation heat map report shown above, tracking the heat of the # Tickets metric throughout the work week.
Create a new report:
In the Custom Metric Editor, create the following metric for the percentage of tickets compared to the overall count of tickets. The Ticket Percentage metric:
SELECT # Tickets / (SELECT # Tickets BY ALL OTHER)
The BY ALL OTHER clause is important, as it locks the aggregation level of the metric to include all values in the entire result set, regardless of how the metric is sliced.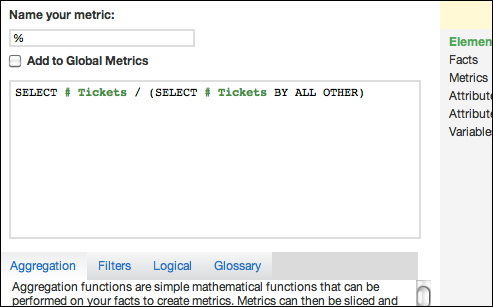
In the How pane, select the Day of Week (Mon-Sun) attribute.
In the How pane, select the select the Hour attribute that you have added to your dataset.
In the Filter pane, click Select from a List of Values (including date ranges). Select the Week (Mon-Sun) / Year (Created) attribute. Set the filter to include values for as far back as you are interested in tracking their heat.
This percentage can now be compared against other values to show a relative scale. You should now see the values in the table, broken out by hour of the week. To make the table more readable, you can apply conditional number formatting to instruct the GoodData Portal to format the boxes based on specified color values. These color values should be relative to the other boxes in the table, so that you can measure the “heat” of each time period against the other periods in the table. For clarity, you can also hide the values, so that the users focus on the colors only.
Here, we use custom formatting codes to generate colors. The colors are defined by the Custom Formatting module in the Show Configuration panel. For more information, see Formatting Numbers in Insights and Reports.
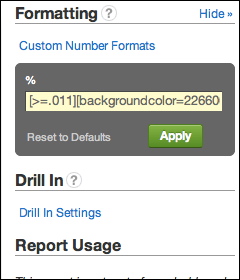
Below are the conditional number formatting for three different color schemes. You can choose the one that works for you. Just copy and paste the code you want in the custom formatting box and modify as necessary.
Blue Red Green [>=.011][backgroundcolor=0A1F33][color=0A1F33]#%;
[>=.01][backgroundcolor=143D66][color=143D66]#%;
[>=.009][backgroundcolor=1F5C99][color=1F5C99]#%;
[>=.008][backgroundcolor=297ACC][color=297ACC]#%;
[>=.007][backgroundcolor=3399FF][color=3399FF]#%;
[>=.006][backgroundcolor=5CADFF][color=5CADFF]#%;
[>=.005][backgroundcolor=85C2FF][color=85C2FF]#%;
[>=.004][backgroundcolor=ADD6FF][color=ADD6FF]#%;
[>=.003][backgroundcolor=D6EBFF][color=D6EBFF]#%;
[>=.002][backgroundcolor=EBF5FF][color=EBF5FF]#%;
[<.002][backgroundcolor=ffffff][white]0;
[=Null][backgroundcolor=ffffff][white]0
[>=.011][backgroundcolor=660011][color=660011]#%;
[>=.01][backgroundcolor=99001A][color=99001A]#%;
[>=.009][backgroundcolor=CC0022][color=CC0022]#%;
[>=.008][backgroundcolor=FF002B][color=FF002B]#%;
[>=.007][backgroundcolor=FF3355][color=FF3355]#%;
[>=.006][backgroundcolor=FF667F][color=FF667F]#%;
[>=.005][backgroundcolor=FF99AA][color=FF99AA]#%;
[>=.004][backgroundcolor=FFCCD5][color=FFCCD5]#%;
[>=.003][backgroundcolor=F7D4DA][color=F7D4DA]#%;
[>=.002][backgroundcolor=F0DBDF][color=F0DBDF]#%;
[<.002][backgroundcolor=ffffff][white]0;
[=Null][backgroundcolor=ffffff][white]0
[>=.011][backgroundcolor=226600][color=226600]#%;
[>=.01][backgroundcolor=339900][color=339900]#%;
[>=.009][backgroundcolor=44CC00][color=44CC00]#%;
[>=.008][backgroundcolor=55FF00][color=55FF00]#%;
[>=.007][backgroundcolor=77FF33][color=77FF33]#%;
[>=.006][backgroundcolor=99FF66][color=99FF66]#%;
[>=.005][backgroundcolor=BBFF99][color=BBFF99]#%;
[>=.004][backgroundcolor=DDFFCC][color=DDFFCC]#%;
[>=.003][backgroundcolor=DFFAD1][color=DFFAD1]#%;
[>=.002][backgroundcolor=E3EDDE][color=E3EDDE]#%;
[<.002][backgroundcolor=ffffff][white]0;
[=Null][backgroundcolor=ffffff][white]0