Calculate Percentage Shares
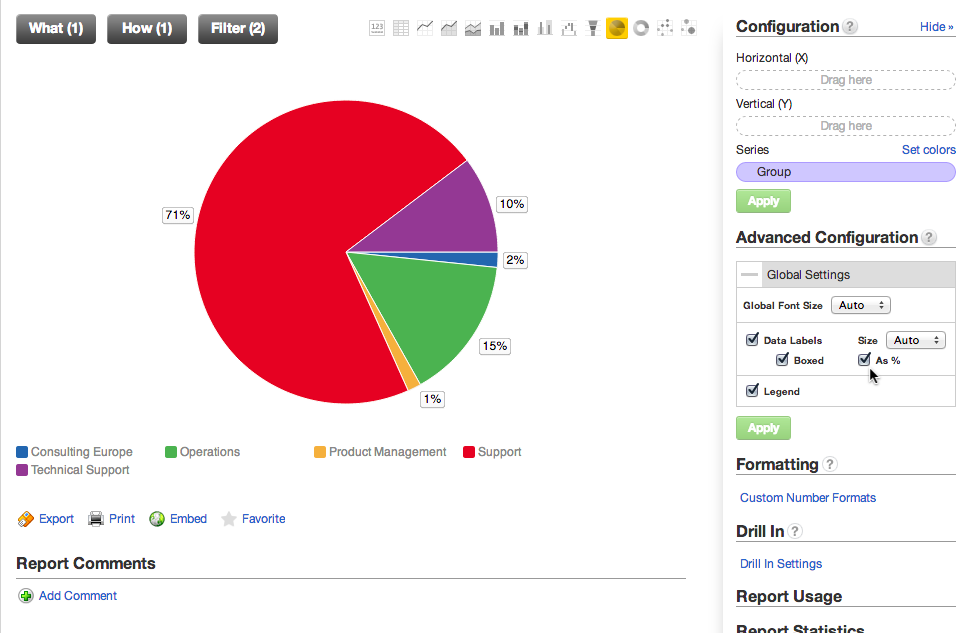
In many chart types, it is easy to calculate the percentage share of a value compared to the entire results in the report.
In the Show Configuration panel, click the “As %” box for the metric of interest:
However, the above technique does not work for tabular reports, where this option is not not available. This tutorial provides some suggestions for how you can display percentage shares in tables, using the example of a customer support system.
Calculating percentage of one metric compared to another
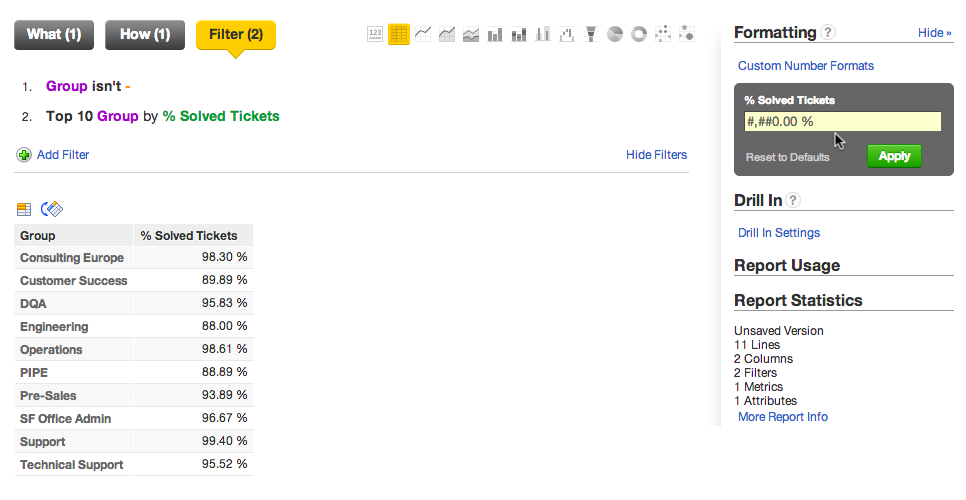
Suppose you want to compute the number of solved support tickets to the total number of tickets. The metric definition for the % Solved Tickets looks like the following:
SELECT # Solved Tickets / # Tickets
This one-cell report can be enhanced by slicing it by the Group attribute. Applying a Top 10 filter and some custom number formatting yields something like the following:
Calculating percentage of the same metric to show shares over time
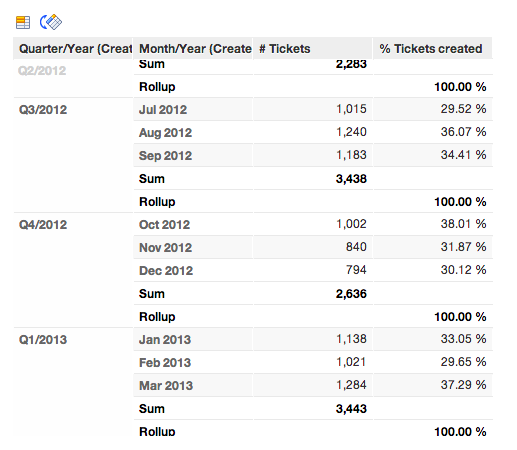
Suppose you must track how metric values compare to the total value for the metric over time. Suppose the # Tickets counts the total number of tickets. You can then look at the percentage distribution of tickets throughout the quarter in the following % Tickets by Quarter metric:
SELECT # Tickets / (SELECT # Tickets BY Quarter/Year (Created))
The numerator of the above metric should not be restricted, so that you can enable it to be sliced by the attributes on the report level. The denominator determines the level at which the count of tickets is summed.
The results should look something like the following:
Percentages across all values
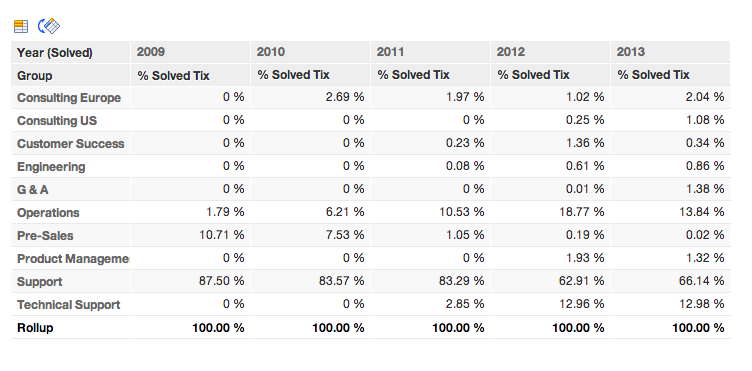
In some cases, you may wish to calculate percentages across the entire set of values for the metric at a specific aggregation level. In the following example, the definition of the % Tickets Solved metric is computed by tabulating the solved tickets across all dimensions, except for the year level:
SELECT # Solved Tickets / (SELECT # Solved Tickets BY ALL IN ALL OTHER DIMENSIONS EXCEPT Year (Solved))
By itself, the BY ALL IN ALL OTHER DIMENSIONS would force calculation of the # Solved Tickets metric across all dimensions. However, to calculate at the yearly level, the exception must be added. The results look like the following:


