Aggregate Table Data
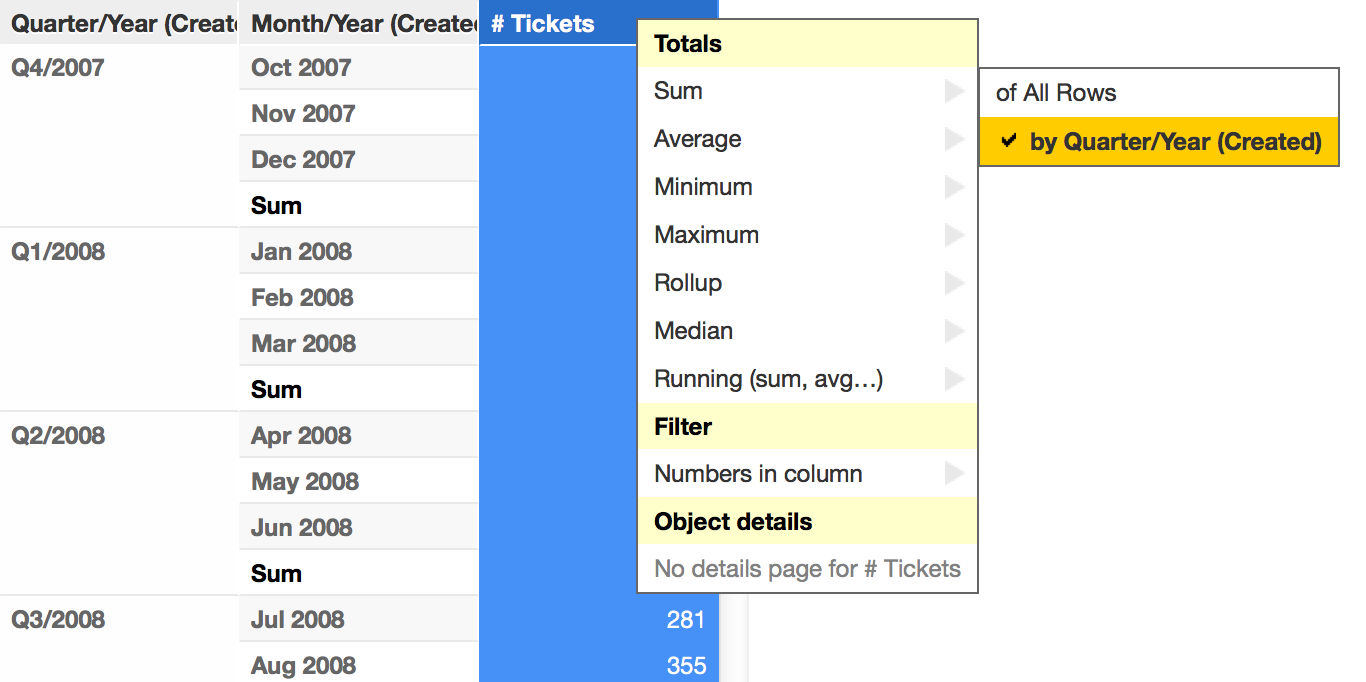
Options for aggregating data can be accessed by secondary-clicking a metric header. Depending on the orientation of a table, metric headers may appear atop columns or to the left of each row.
There are seven different types of Totals:
- Sum
- Average
- Minimum
- Maximum
- Rollup
- Median
- Running
Totals are useful for aggregating all the data in a given row or column and displaying that aggregated value in a new column/row of your table.
Consider the following limitations:
- If you have data in your table aggregated and grouped within a certain attribute, you cannot apply sorting to the data (ascending/descending order in any column): if you do so, the grouping will stop working correctly.
- If you have data in your table aggregated and sorted by a certain attribute, you cannot group the data within a certain attribute: the grouping will not return correct values.
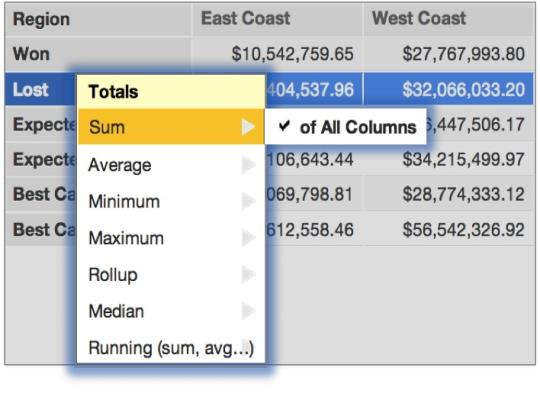
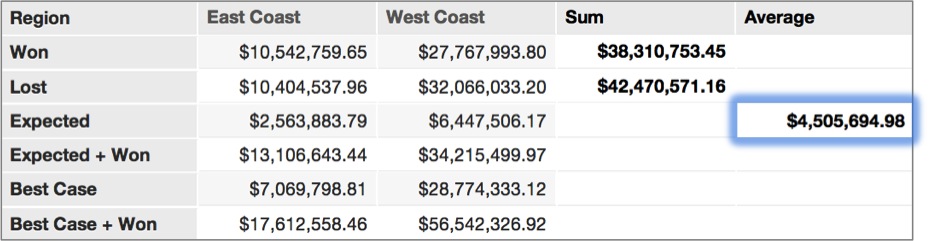
In the following example, the values of amount lost that appear in each column of the table (signifying the East Coast and West Coast regions) could be aggregated as a sum and displayed in a new column of the Lost row:
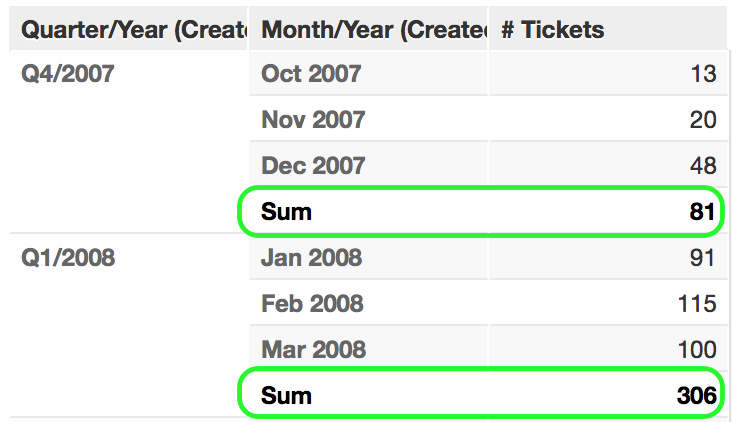
The resulting table would show the sum of the columns along the Lost row. Notice that only the sum for the Lost row appears, as this was the row that was secondary-clicked:
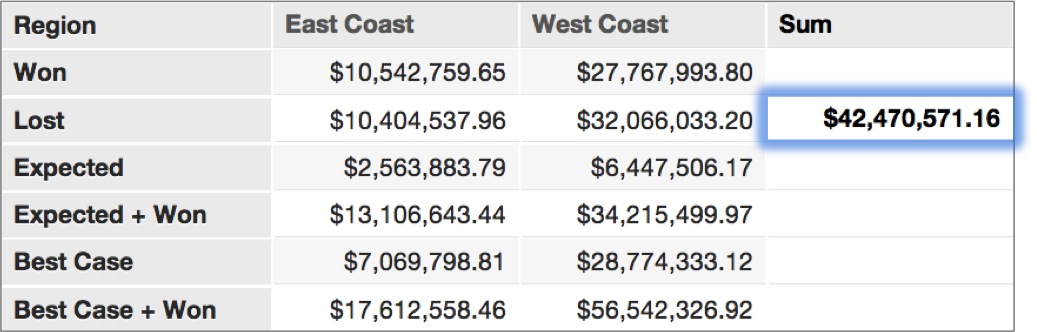
You can also display the sum of other rows in the Sum column by following the same procedure.
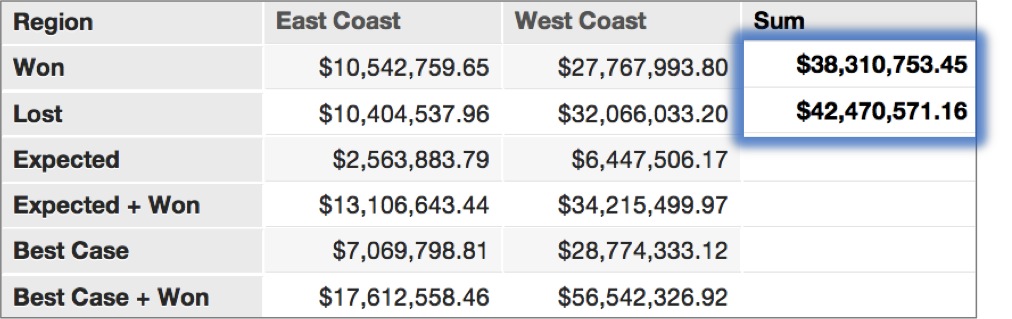
In this way, a sum total amount won can be added to the Sum column:
Should you select a new type of aggregation, like the Average for all the values in a given row, a new column is formed for averages:
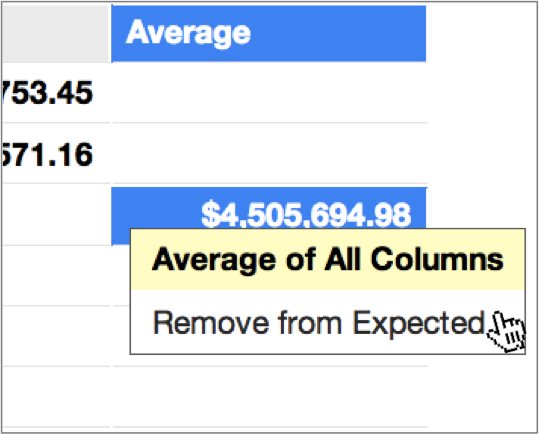
In the same way as aggregated values are applied manually, one at a time, they can also be removed individually. To remove an aggregated value, right-click where it appears in the table and select Remove from [Header Name]:
You can group aggregated data in your report by one of the present attributes:
Rollup Totals:
Rollup totals are “smart” aggregations. They are useful for tables that display metrics representing average values. Specifically, rollups are useful for avoiding unhelpful aggregations like averages of averages.
In the following example, a rollup in the last column performs different aggregations depending on the metric at hand. For the (Amount) Won metric in the first row, the rollup represents the sum of all regions' won amounts. (Notice that the Sum and Rollup columns are equal.)
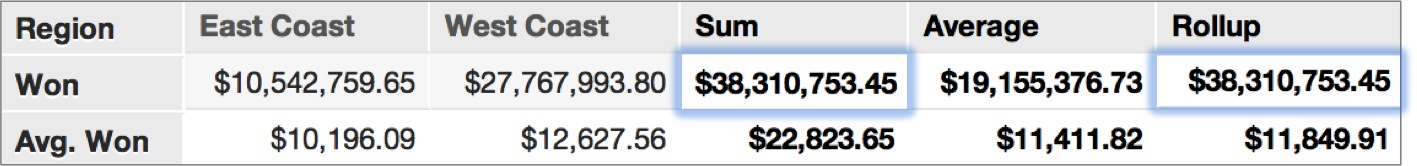
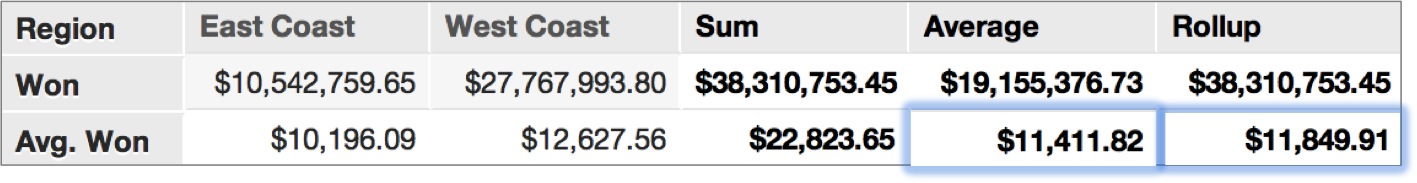
But for the Average Won metric in the second row, rather than take the average of the row’s values (which are already averages), the Avg. Won Rollup averages the original underlying data—before it was aggregated by the Won metric and broken into the East Coast and West Coast regions by the Region attribute. Notice how the value in the final row of the Average column (an average of averages) differs from the rollup average (an average based on the original underlying data).
Running Totals:
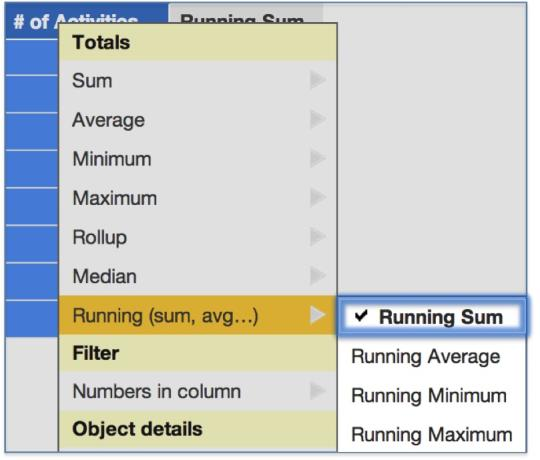
Running totals are aggregations that are displayed alongside a row or column of metrics, depending on the orientation of a table. In the following example, a Running Sum column has been added by secondary-clicking the # of Activities metric header and selecting the Running Sum option:
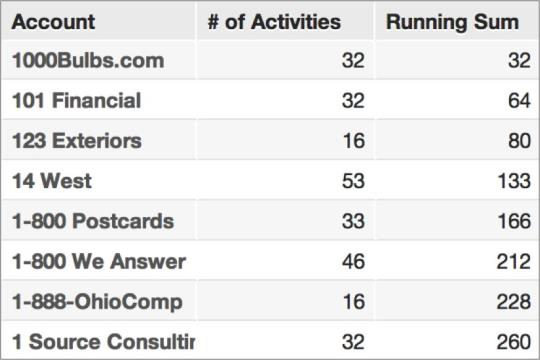
The result is a new column that displays the running sum of the # of Activities metric values:
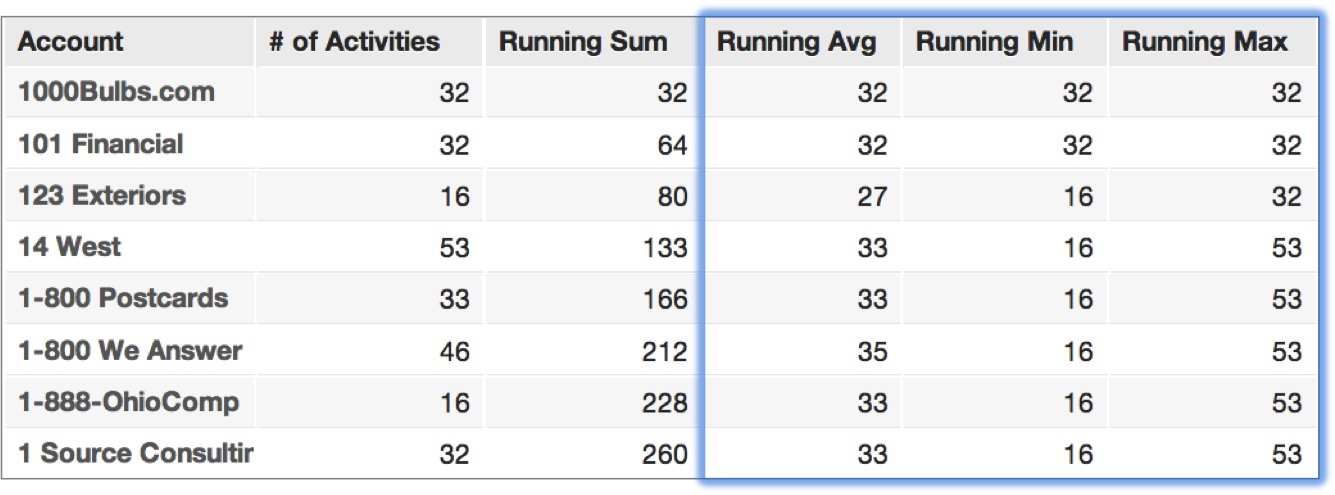
Multiple running total columns can be added to display various running aggregations of the same metric values. To continue on with the previous example, we could add a running average, minimum value, and maximum value to our table, all of which relate to the # of Activities metric values:
You can delete running total rows and columns by secondary-clicking the header and selecting Remove from [metric name].