Add Color Formatting to Tables
You can add colors to your tables to make the important areas of your report stand out, which simplifies locating key information.
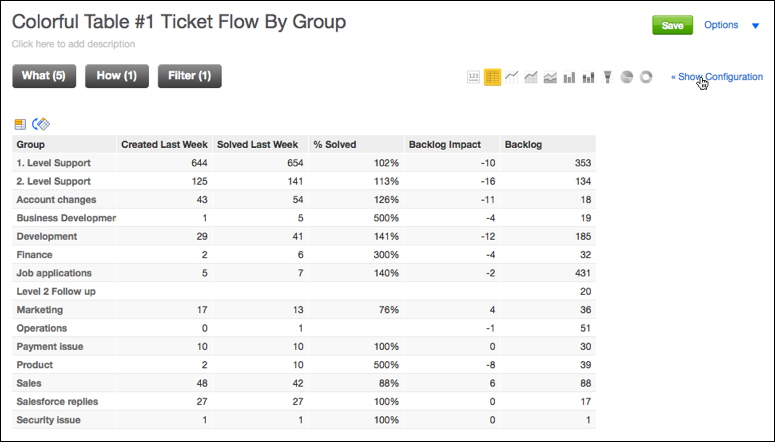
This tutorial adds color to a help desk report to assist in rapidly identifying where the backlog is changing week-over-week.
Steps:
When the report is displayed in the Report Editor, click Show Configuration.
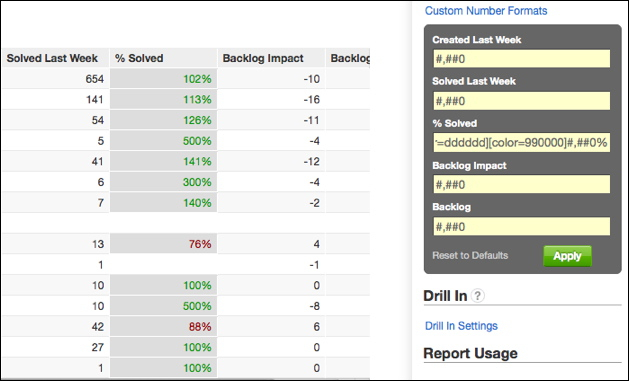
Click Custom Number Formats. A list of report metrics opens.
Click Edit in the % Solved field. The number format editor opens where you can customize the formatting for each column of the report. Using custom formatting, you can add conditions and color codes to the formatting rules. For more information on report syntax, see Conditional Number Formatting.
Click Conditional colors.
In the editor filed, insert the following syntax:
[>=1][backgroundcolor=dddddd][color=009900]#,##0%;
[<1][backgroundcolor=dddddd][color=990000]#,##0%
This syntax covers the following conditions for color formatting:
Metric Value
Description
1
No impact
<1
Negative impact
>1
Positive impact
The syntax breaks down into the following two parts:
[>=1][backgroundcolor=dddddd][color=009900]#,##0%;Code
Description
[>=1]
For values greater than 1, do the following:
[backgroundcolor=dddddd]
Set the background color to hexadecimal color value #dddddd
[color=009900]
Set the font color value to hex value #009900 (green)
#,##0%
Format metric values by rounding to the nearest whole number percent
[<1][backgroundcolor=dddddd][color=990000]#,##0%Code
Description
[<1]
For values less than 1, do the following:
[backgroundcolor=dddddd]
Set the background color to hexadecimal color value #dddddd
[color=990000]
Set the font color value to hex value #990000 (red)
#,##0%
Format metric values by rounding to the nearest whole number percent
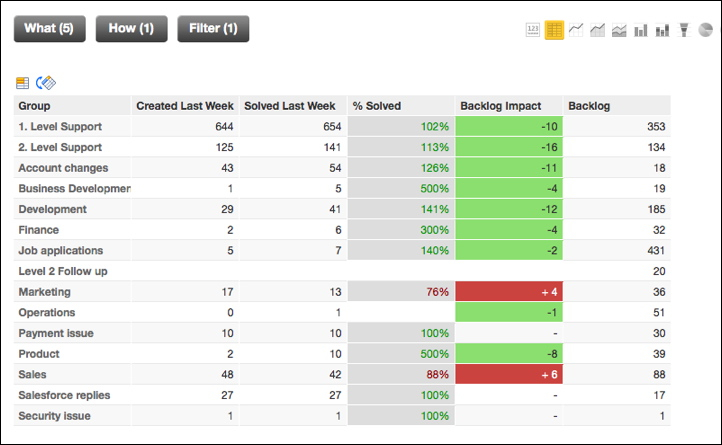
Click Apply. The chart now displays:
- (Optional) Apply background color formatting to the Backlog Impact metric to clearly identify areas that should be monitored:
- Click Save to save the report.