Maximum Report Size
To prevent issues with overloading your browser, the GoodData platform imposes limits on the volume of data that can be displayed in any single report.
These limits apply to both the reports that you create via the Report Editor (see Creating New Reports in the Report Editor) and the insights that you create using Analytical Designer (see Create Insights).
Limit Types
Limits Applied to the Definition of a Report
When you are defining a report (what metrics to analyze, what attributes to use to contextualize the metrics, and optionally what filters to set up), the GoodData platform limits the number of elements that you can use:
- 20 metrics per report
- 20 attributes per report
- 200 values per report filter
- 500 values per dashboard filter
The GoodData user interface does not allow you to add more elements than the limits set (for example, if your report has 20 attributes and you try to add one more, you will see an error message).
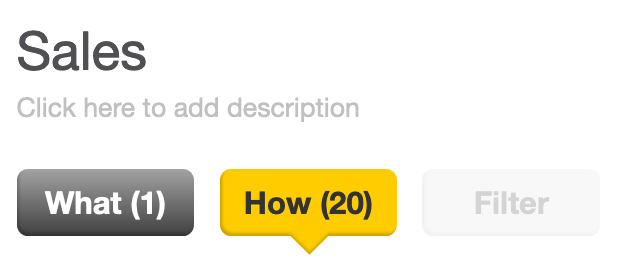
In the following picture, the number next to How indicates how many attributes the report has, which is 20.
Limits Applied to a Generated Report
In addition to the limits applied to the definition of the report, the GoodData platform also applies limits to the generated result report that is computed and built based on what you provided in its definition. Those limits are related to the number of columns, rows, and cells in the report.
A report can contain up to:
- 60,000 rows
- 60,000 columns
- 5,000,000 cells containing non-null values This limit can be reached if you are including multiple metrics broken down by multiple attributes that are arranged vertically and horizontally.
- 60,000,000 cells including those with null values This is the total number of cells that a report can contain. Because the null values are not calculated, there is less processing required, so the limit is higher than the limit for the number of cells containing non-null values.
These limits are applied during report computation, and the report is checked against all of them. When any of these limits is exceeded, the report is not displayed, and you see the following message:
Please limit the result set by removing some attributes, removing some metrics, applying filters, or pivoting.
More info: Reports that are considered "too large" exceed the maximum allowable table size. Please try to limit your result set to less than 60,000 rows/columns, or less than 6,000,000 total cells.
To acquire the report data as specified, download the raw report data (CSV).
These limits are also applied when you try to export such reports to formatted CSV, PDF, or Excel using the API. The API will check the report against the limits and will fail.
What to Do when the Report Exceeds a Limit
To get the report to display, try the following:
- Remove some attributes from the report.
- Remove some metrics from the report.
- Apply filters to the report (see Filter Pane - Filtering within a Report).
- Display the report as a table (see Display a Report as a Table) and pivot it (see Pivot a Table).
To get the report data, export the report to raw CSV. The option of exporting to raw CSV is available directly from the message that is displayed instead of the report, or you can use the API for exporting large reports.
The result CSV file can contain up to 10,000,000 rows and cannot exceed 1 GB.
Examples of Applying the Limits to a Report
No Limit Exceeded
A report contains 400 rows and 12,000 columns.
- Number of rows 400 rows < 60,000 rows maximum
- Number of columns 12,000 columns < 60,000 columns maximum
- Total number of cells 4,800,000 < 60,000,000 cells maximum
- Number of cells containing non-null values (Even if all report cells contain non-null values) 4,800,000 < 5,000,000 cells maximum
The report is displayed normally.
Limit Exceeded: Max Number of Rows
A report contains 67,000 rows and 18,000 columns.
- Number of columns 18,000 columns < 60,000 columns maximum
- Number of rows 67,000 rows > 60,000 rows maximum
The report is not displayed. You see the “Report too large” message.
Limit Exceeded: Max Number of Columns
A report contains 300 rows and 75,000 columns.
- Number of rows 300 rows < 60,000 rows maximum
- Number of columns 75,000 columns > 60,000 columns maximum
The report is not displayed. You see the “Report too large” message.
Limit Exceeded: Total Number of Cells
A report contains 50,000 rows and 2,000 columns.
- Number of rows 50,000 rows < 60,000 rows maximum
- Number of columns 2,000 columns < 60,000 columns maximum
- Total number of cells 100,000,000 > 60,000,000 cells maximum
The report is not displayed. You see the “Report too large” message.
Limit Exceeded: Number of Cells Containing Non-null Values
A report contains 50,000 rows and 1,000 columns.
Number of rows 50,000 rows < 60,000 rows maximum
Number of columns 1,000 columns < 60,000 columns maximum
Total number of cells 50,000,000 < 60,000,000 cells maximum
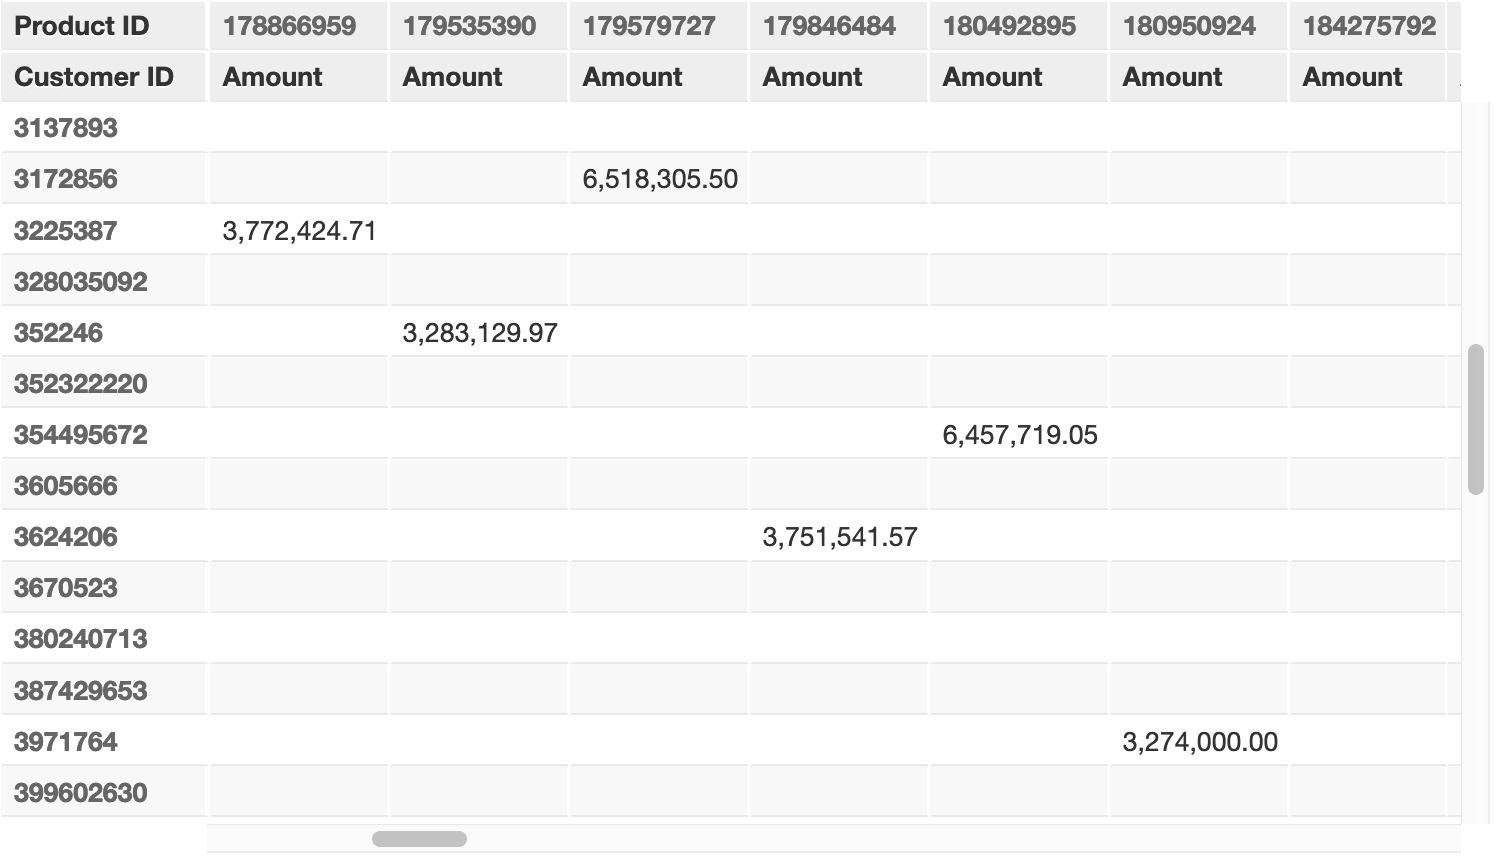
Number of cells containing non-null values Let’s say that this report shows sales amounts broken down per customer (50,000 customers = 50,000 rows) and per product (1,000 products = 1,000 columns). The report will be displayed as long as the number of the cells with non-null values does not exceed the limit of 5,000,000. As soon as this limit is exceeded, the report will no longer be displayed, and you will see the “Report too large” message.
How the number of the cells with non-null values changes Not every customer buys all products. Some customers may buy only one product, some customers may buy multiple products. Therefore, depending on how many products each customer buys, the report will contain a certain number of non-null values (cells with actual amounts), and the remaining cells will be empty (cells with null values).
There may be multiple combinations of the number of the customers and the number of the products to reach the limit of 5,000,000 cells with non-null values. For example, you may have some customers who buy all 1,000 products. As soon as the number of such customers exceeds 5,000 (5,001 customers or more), the report will exceed the limit for the number of cells with non-null values (more than 5,000,000 cells) and will no longer be displayed.
The Limits in the UI vs. API
The limits are primarily forced for the reports displayed in the UI. In some cases, you may work around the limits by generating a report exceeding one or multiple limits via the API or gray pages. While this is technically possible, such reports may still not be generated.