Drilling Down
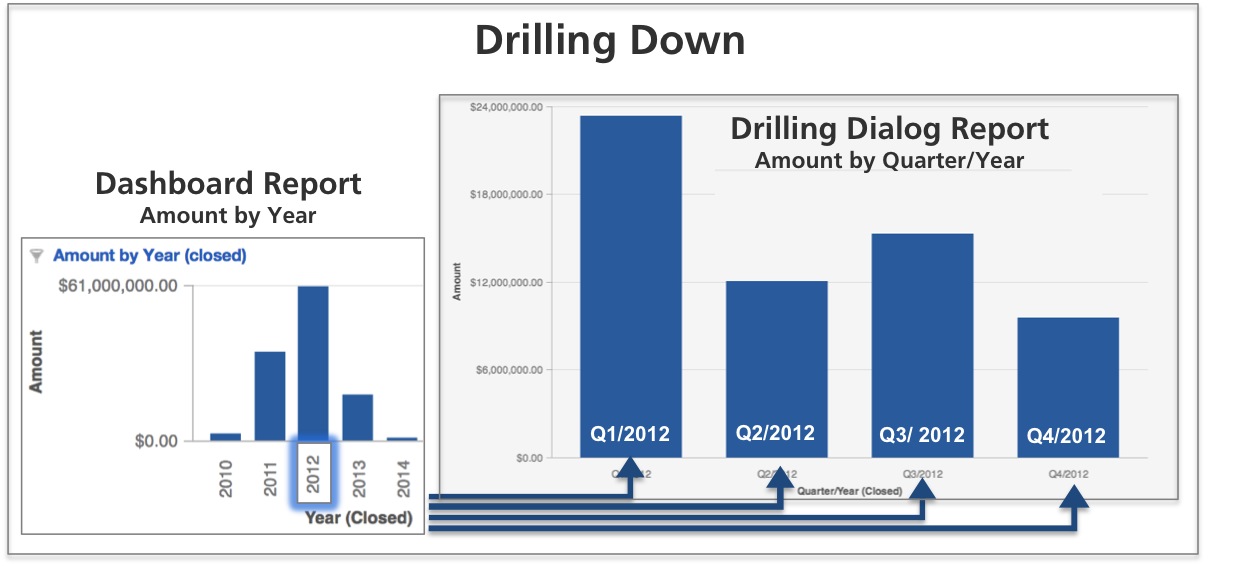
Drill-down drill paths are initiated when a user selects an attribute value. This link opens another chart that measures the same metric as the original report but breaks that metric across a new attribute, while filtering for the attribute value selected in the original report.
In the following example, the original report breaks down Amount (metric) by Year (attribute). Because a drill-down drill path has been defined, clicking 2012 leads to another report that breaks Amount down by Quarter. Since you clicked the 2012 attribute, only the quarters in 2012 are displayed in the second report. Data from other quarters has automatically been filtered out as part of the drill down.
Drill-down paths are often created to link attributes from the same attribute dimension (hierarchy) in order of increasing granularity. This drilling path allows users to break a given report metric down into smaller and smaller chunks. Examples:
A user viewing a report displaying Amount by Year might drill down to see Amount broken down by Quarter and then drilling again to break down the metric by Month, and then by Date (Day), all within the same Year.
As a non-date example, drill-down paths could be used to navigate this hierarchy: Industry > Corporation > Division > Product Team > Employee.
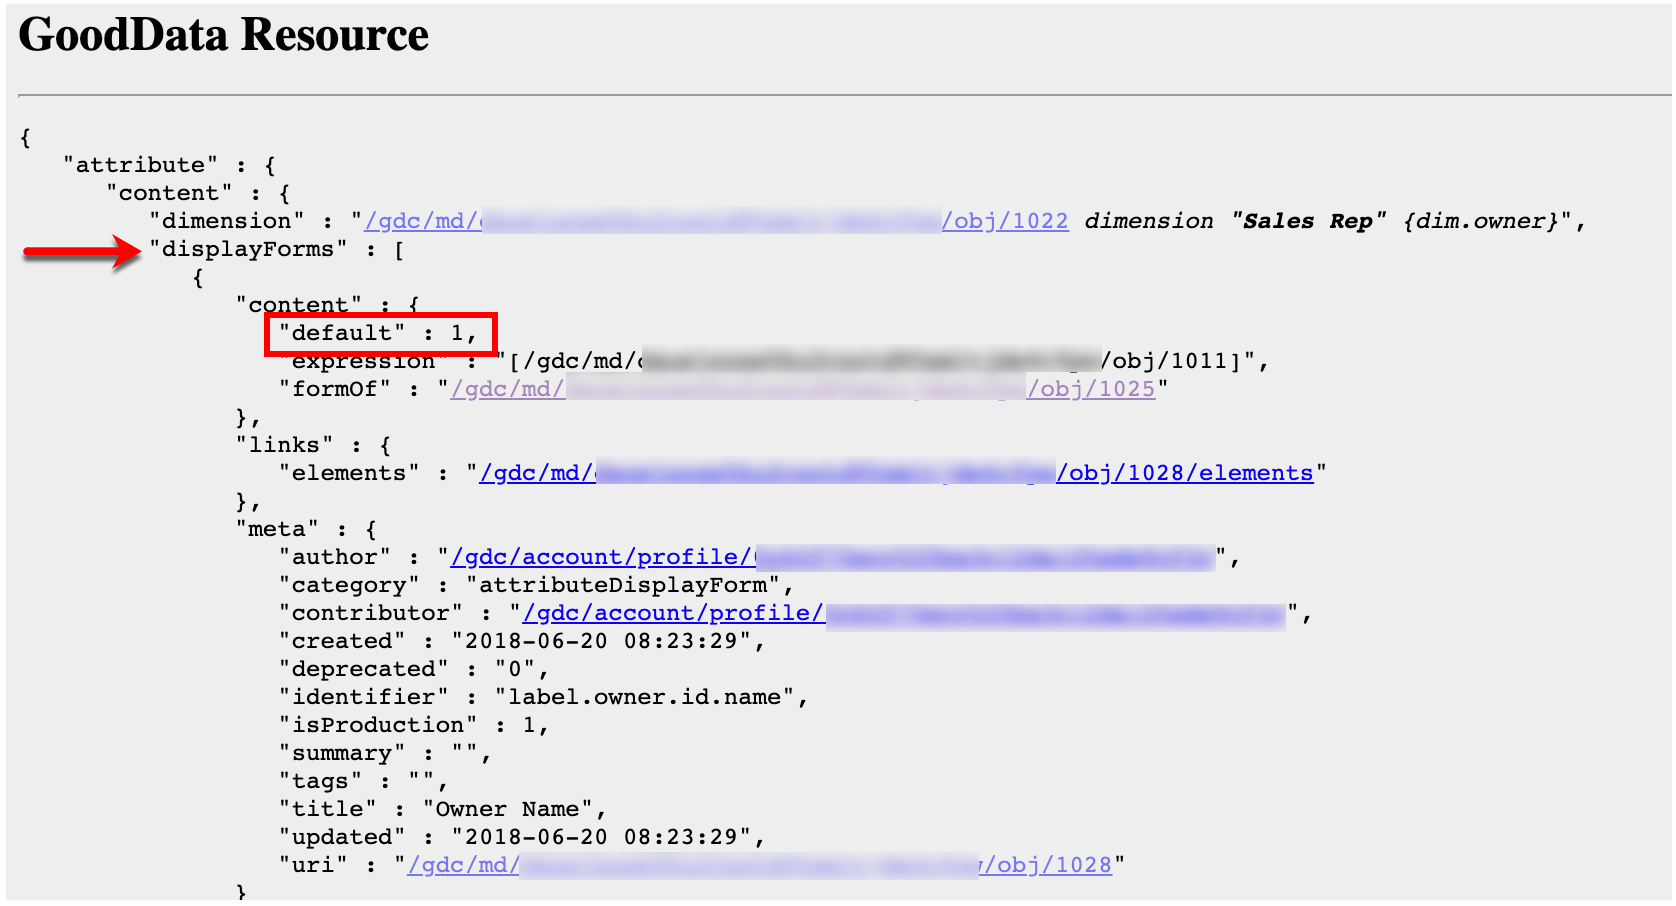
If the attribute has multiple labels defined, the target report always displays the default label.
To verify the labels defined, click the attribute name in Manage → Attributes.
To see which label is default:
- Go to the Gray Pages (see Access the Gray Pages for a Workspace).
- Click metadata → query → attributes. You can access the query page also via GoodData Extension Tool for Chrome.
- Click the desired attribute name.
- In the displayForms section, find the label with
defaultset to1.
Drilling Down through Attribute Hierarchies
Drill-down paths can be particularly useful for leading users through the hierarchy of an attribute dimension. For example, a user viewing sales amount broken down by year could drill down to see the same metric broken down by quarter before drilling down again to view the data broken down by month and then date (day).
A non-date example of a similar drill down hierarchy could be Industry > Corporation > Division > Product Team > Employee.
Defining Local Drill-Down Paths
Steps:
- While on your dashboard in edit mode, select a dashboard report, and click the Gear icon.
- From the Drilling tab, click + Add Drilling or Add more… to add a new drill path.
- Under When I click on, click the drop-down, and select the attribute of interest. Click Select. Values of the selected metric will be the links that allow dashboard viewers to initiate your drill-down path.
- Under Show me, click the drop-down.
- From the Attributes tab, select the new attribute to be used to break down the original report’s metric. Click Select.
- After checking your new drill-down settings, click Apply. The dialog closes. The drill path is added.
- Click Save. The dashboard is saved.
VIDEO - How to Set Drill-down Paths to Your Attributes
Defining Global Drill Down Paths
For detailed information, see Defining Global Drill Down Paths.


