Creating New Reports in the Report Editor
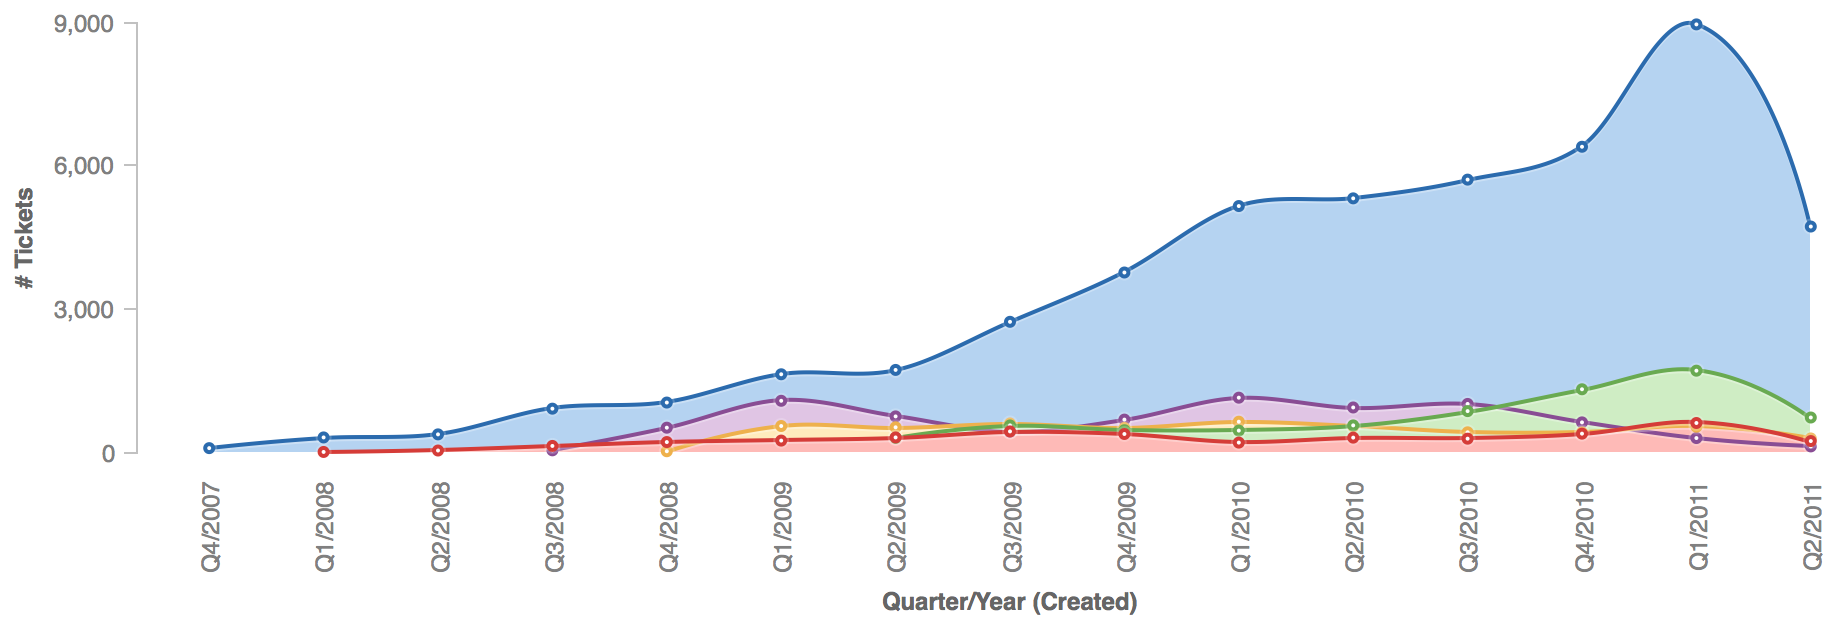
A report is a chart or table of metrics that has been designed to surface meaningful analytics into the GoodData Portal for stakeholders to review. A report contains one or more aggregation functions applied to numerical facts and optionally segmented by one or more attributes.
Reports are organized into Dashboards.
All reports have at least one metric (what you analyze) and – with the exception of headline reports – typically have one or more attributes (how, or in what context, you analyze your metrics). Reports can also have filters, which allow you to zero in on certain subsets of data by excluding data that is not of interest.
Before you start, verify that you have the necessary metrics and attributes in your workspace. To learn more, see Get Started with Using MAQL to Write Metrics.
Steps:
On the top of the page, click Reports. The Reports page opens.
Click Create Report. A form for creating a report opens. You are now going to define metrics for your report.
Click What. A pane with all your workspace metrics opens. If no metrics appears, create them as needed (see What Pane - Adding Metrics to Reports).
In the left column, select a folder or a tag to display the metrics that you need. The metrics are listed in the center column.
Select the check boxes for the metrics that you want to add to your report. To show a metric’s details in the right column, click the metric.
The number next to What indicates how many metrics you have selected.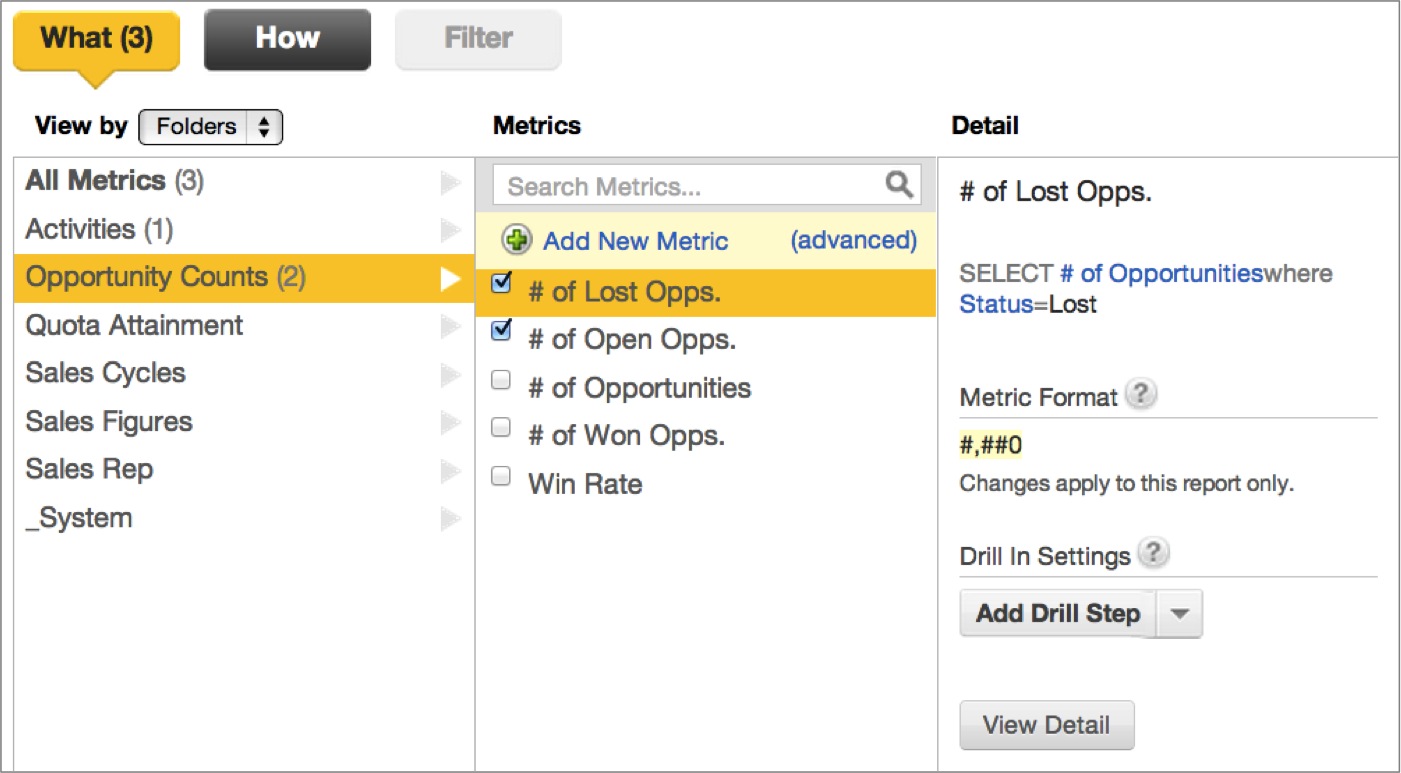 For more information about the What pane, see What Pane - Adding Metrics to Reports.
Now, you are going to define attributes for your report. If you are creating a headline report, skip this step, and proceed to Step 9. For more information, see Creating a Headline Report.
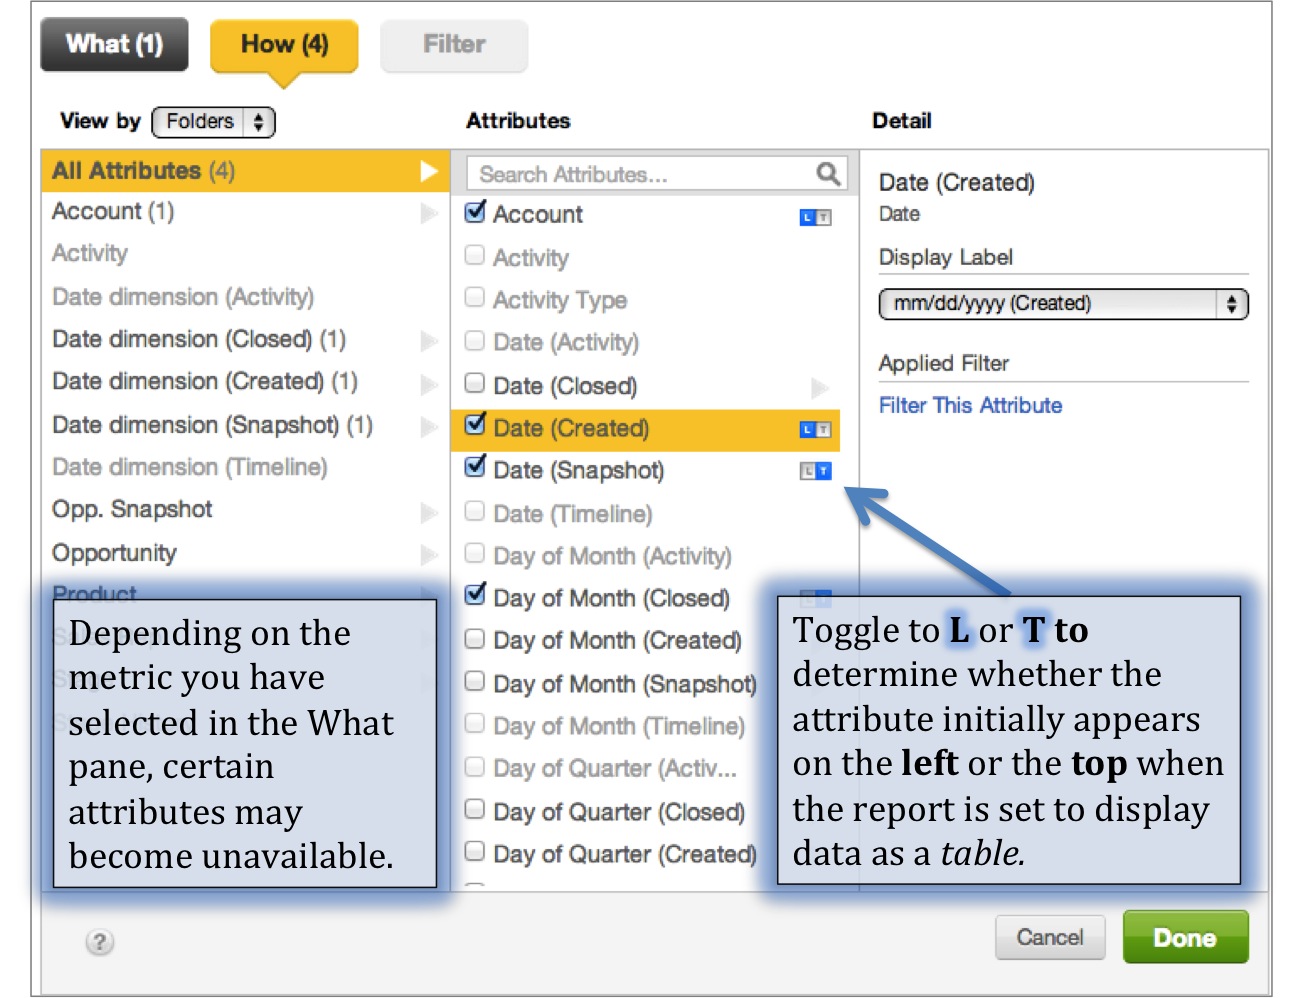
Click How. A pane with all your attributes opens.
In the left column, select a folder or a tag to display the attributes that you need. The attributes belonging to the selected folder or tag are listed in the center column.
Select the check boxes for the attributes that you want to use to contextualize your metrics. To show an attribute’s details in the right column, click the attribute. The number next to How indicates how many attributes you have selected.
In many cases, you will choose just one attribute, but for some charts and use cases you may wish to choose two or more.
Depending on the metrics that you have selected in the What pane, certain attributes can become unavailable (grayed out). Attributes that are not valid for the metric are disabled so that you do not couple metrics and attributes. This feature prevents you from creating nonsensical or invalid reports.
For more information about the How pane, see How Pane - Adding Attributes to Reports.
Click Done. The report is generated and displayed. By default, the report is generated as a table. At this point, the report is not yet saved.
(Optional) Click Filter. Then, select and configure the filtering option that you want to apply (see Filter Pane - Filtering within a Report). The number next to Filter indicates how many filters you have applied.
(Optional) Change the report representation from the default table. You can display it as:
- A headline report (see Creating a Headline Report) or
- A chart (see Chart Types)
(Optional) Configure the report: click Show Configuration to see available options. You are now ready to save the report. For information about report configuration, see Working with Charts.
Click Create. A dialog opens, and you are prompted to fill in the report’s properties.
Review and specify the needed properties, and click Create. The dialog closes. The report is saved and appears in the list of reports on the Reports page.
VIDEO - How to Create Reports in GoodData
Also in this section: