Build a Period-Over-Period Report
In period-based reporting, surfacing trends in the data is critical to delivering value. With the GoodData Portal, you can build reports that highlight trends in your data so users can see critical trends without having to scour the data.
Below is an example help desk report showing period-over-period percentage change of ticket creation from month to month.
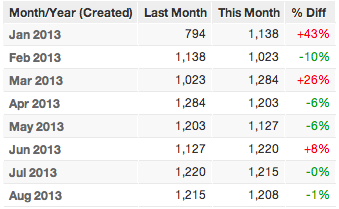
You can use this report to quickly identify the months in which there was change in the % Diff column. This article describes how to build a similar report, using three metrics and conditional formatting.
Calculation of Period-Over-Period after Update October 4th 2018
Improvements to period-over-period calculations now result in more accurate reports after fixing inconsistent behaviour, especially those that involve leap years. The table below displays calculation behavior after this improvement:
| MAQL | FOR PREVIOUS... | After update 4th October 2018 |
|---|---|---|
Date BETWEEN 1/1/2017 AND 3/31/2017 | year | 1/1/2016 - 3/31/2016 |
Date BETWEEN 4/15/2018 AND 5/15/2018 | month | 3/15/2018 - 4/15/2018 |
Date BETWEEN 3/31/2018 AND 4/6/2018 | month | 2/28/2018 - 3/6/2018 |
Date < 2/29/2016 | year | dates before 2/28/2015 (excluded) |
Date < 3/30/2018 | month | dates before 2/28/2018 (excluded) |
Date = 2/29/2016 | year | Date = 2/28/2015 |
Date IN (2/29/2016, 3/1/2016, 3/2/2016, 3/15/2016) | year | Date IN (3/1/2015, 3/2/2015, 3/15/2015) Date IN (2/28/2015, 3/1/2015, 3/2/2015, 3/15/2015) |
Metric 1: Tickets Created This Month
This metric is assumed to be part of the source data.
The # Tickets metric here is computed using COUNT of the instances of tickets. After this metric is added to the report, the report must be sliced by the attribute Month/Year (Created).
Metric 2: Tickets Created Last Month
In the Custom Metric Editor, create the metric Last Month:
Select # Tickets FOR PREVIOUS (Month/Year (Created))
Since this metric uses MAQL keywords, it must be created in the Custom Metric Editor. Custom metrics must be created by choosing the objects from the pick lists.
This metric is very similar to the first one, except for the inclusion of the FOR PREVIOUS clause. In this case, you are selecting the number of tickets for the period prior to the current period, as indicated for the Month/Year Created attribute.
Metric 3: % Diff
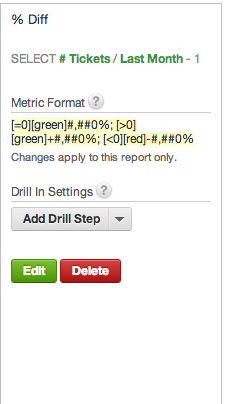
Create the metric % Diff in the Custom Metric Editor:
Select # Tickets / Last Month - 1
This metric references the # Tickets metric and then divides it by the value computed in the Last Month metric. To turn the rendered value into a percentage, you must subtract 1. This metric should be dynamically colored based on the data contained in each month. Using conditional number formatting, you can impose the following color-coding to your metric:
- Value = 0: green
- Value > 0: green
- Value > 0: red
If the % Diff value is greater than 0, then this month’s ticket volume is greater than last month’s volume and is redlined for investigation. In the Report Editor, click Show Configuration. Then, click the Custom Number Formats link. In the % Diff textbox, enter the following:
[=0][green]#,##0%; [>0][green]+#,##0%; [<0][red]-#,##0%
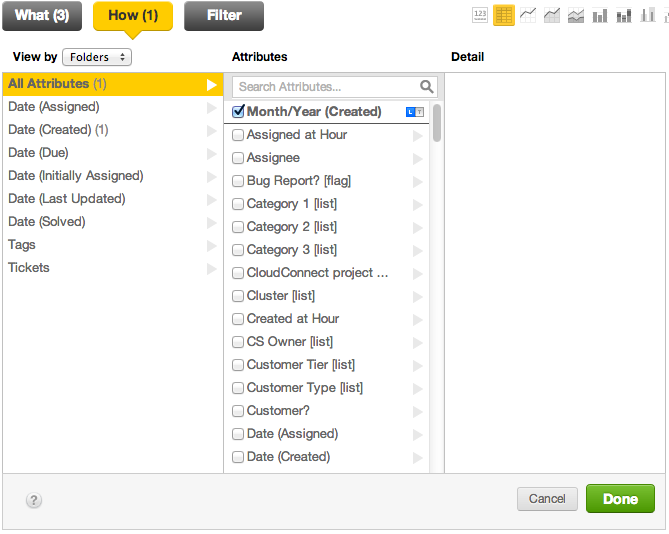
Finishing the Report
Add your new metrics to the report. Make sure that you add the Month/Year (Created) attribute to the How pane.
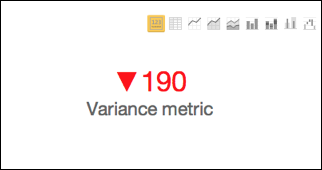
Extending with a Headline Report
Now that you have created the metrics for this report, you can highlight the current month’s trending information in a headline report. A headline report contains a single number and typically appears at the top of a dashboard to highlight critical values.
Steps:
Start with a blank report.
You must create a metric to tabulate this month’s # of tickets. In the previous example, you tabulated monthly # of tickets by slicing the # of tickets by attribute. In this case, you must create an explicit metric. In the Custom Metric Editor, create the This Month metric with the following MAQL:
SELECT # Tickets WHERE Month/Year (Created) = THISCreate a new This Month Ticket Difference metric with the following formula:
SELECT This Month - Last MonthAdd the This Month Ticket Difference metric to the report.
Remove the This Month metric, since a Headline report can contain only a single number.
Change the report type to Headline.
Click Show Configuration. Click the Custom Number Formats link.
Enter the following in the This Month textbox:
[<0][red]?#,#00;[=0]#,#00;[green][>0]?#,#00Save the report.