Setting up Data for Geo Charts
GoodData geo charts allow you to visualize data broken down by geographic region. They also allow you to apply pushpins to the map based on data submitted to the workspace.
This article covers how to prepare your data and logical data model before you can start creating geo charts. For more information on how to create a geo chart on your dashboard, see Building a Geo Chart.
Add Geo Data to Your Data
GoodData supports the following types of geo charts:
- Geo regions: world countries, U.S. states, and U.S. counties (up to 5,000 regions per geo chart)
- Geo pushpins: the latitude and longitude of locations (up to 25,000 pushpins per geo chart)
To display your data across regions on a map, you must enrich your data model and workspace data with a column referencing appropriate boundaries. This column would relate data values to the supported geographic regions or locations, and represent the attribute to analyze your data by in geo charts. This developer-level process may require adding the geo chart information as a data source, making changes to your logical data model, and publishing the model to propagate the changes to the GoodData Portal. For more information, see Updating a Data Model in CloudConnect.
Configure Data for Geo Regions
All available values for each type of region are provided in the linked reference files:
| Region type | region_type | Region ID type (region_identifier_type) | Reference file |
|---|---|---|---|
| World countries | worldcountries | iso2 (e.g., US) iso3 (e.g., USA) name (e.g., United States) | |
| U.S. states | usstates | name (e.g., California) code (e.g., CA) geo_id (e.g., 0400000US06) - Census Area ID | usstates.csv |
| U.S. counties | uscounties | geo_id (e.g., 0500000US06097) - Census Area ID | uscounties.csv *County and State columns are included just for reference. They cannot be used as a region identifier. |
| Czech Districts | czdistricts | name (e.g., Praha) - Name name_no_diacritics (e.g., Praha) - Name without diacritics nuts4 (e.g., CZ0110) - NUTS4 knok (e.g., 100) - KNOK | czdistricts.csv |
| Australia States | ausstates | name (e.g., Queensland) - Name code (e.g., QLD) - ISO Code | ausstates.csv |
| Brazilian States | br_estados | cd_geocodu (e.g., 11) name (e.g., AMAZONAS) | |
| Brazilian Municipalities | br_municipios | cod_ibge (e.g., 4305439) name (e.g., Santa Fé de Minas) |
- Data for US States, Counties is provided by US Census Bureau TIGER.
- Data for World Countries is provided by Natural Earth. Read more about iso2 and iso3 country codes.
- Data for Czech Districts is provided by ARCDATA.
- Data for Australia States provided by ABS.
Notice how U.S. states and U.S. counties have multiple identifier types that can be used to refer to any given region. Rather than uploading reference files directly to the GoodData platform, select one of the identifier columns from the reference file and include it in the data that you will be uploading to your dataset (for example, you could either use name or geo_id from the U.S. counties set as your preferred identifier).
Region names must be capitalized as proper names: Texas, New Jersey, District of Columbia.
ALL CAPS names are not permitted.
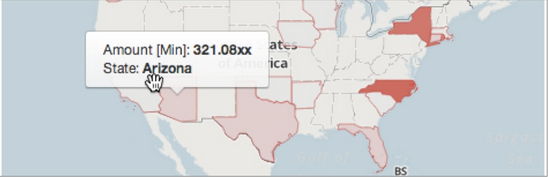
Example: Consider the case where you’d like to create a geo chart that displays sales data broken across U.S. states. Your preexisting data would likely include an attribute with values corresponding to state names (for example, California) or state codes (for example, CA). The example below shows one possible way to formulate this type of data before uploading it to a workspace dataset. In this case, the name identifier is used to refer to different states.
Amount, Opportunity, Date Closed, State
132.2, My Opp, 2013-03-28, California
64.5, My Opp 2, 2013-03-23, New York
....
Ensure that all of your state names (in the State column in your dataset) are identical to the state names in the reference file (column name in usstates.csv in this case).
Configure Data for Geo Pushpins
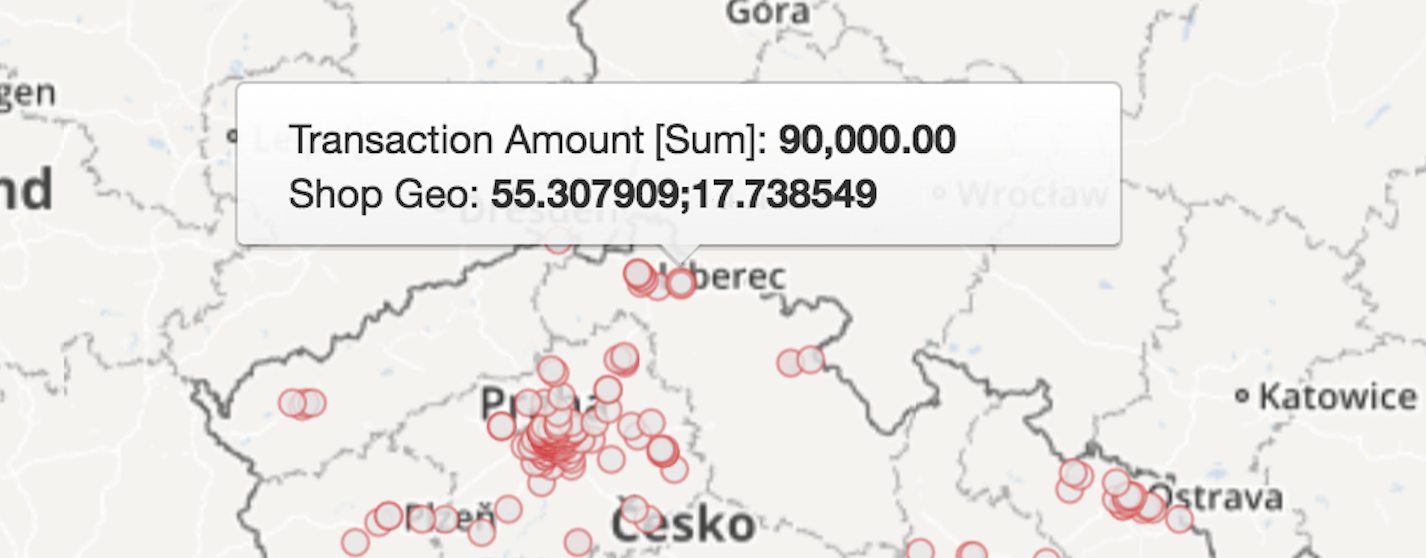
Include the pushpin information in the data that you will be uploading to your dataset. The pushpin information must be in the following text format: <latitude>;<longitude>
Follow these rules:
- Separate the values by a semicolon (
;). - Do not include spaces.
- For latitude, use positive values for the Northern hemisphere, and use negative values for the Southern hemisphere.
- For longitude, use positive values for the Eastern hemisphere, and use negative values for the Western hemisphere.
Example:
37.755919;-122.477711
37.492912;-121.992132
Add a Label to the Regional Attribute
Once you have the geo data added to your data (that is, the attribute with the region names or pushpin data exists in your data model), add a label to that attribute. This label will be used later to connect the attribute and geo charts.
Steps:
- In CloudConnect, on the Navigator tab, open the CloudConnect project folder that contains your logical data model.
- In the folder, locate the LDM file you want to update.
- Double-click the LDM file to open it. The data model is displayed in the Model Editor pane.
- Double-click the dataset that the regional attribute belongs to. The Attributes and Facts window opens.
- Click the plus icon (
 ), select Add Label for, and select the regional attribute. An empty line with the type set to Label is added below the attribute.
 - Enter the label title, and click OK to save the changes.
- Publish the data model. For the detailed instruction on publishing, see Publish Your Logical Data Model in CloudConnect.
Set a Geo Type for the Attribute Label
Once you added the label to the regional attribute, modify the type of the label to match the geo type of your data. This makes the regional attribute available in geo charts.
For more information on the supported geo label types, see Discover Attribute Labels and Drill Paths.
Steps:
- Log in to the GoodData Portal.
- Go to the Manage page, and click Attributes.
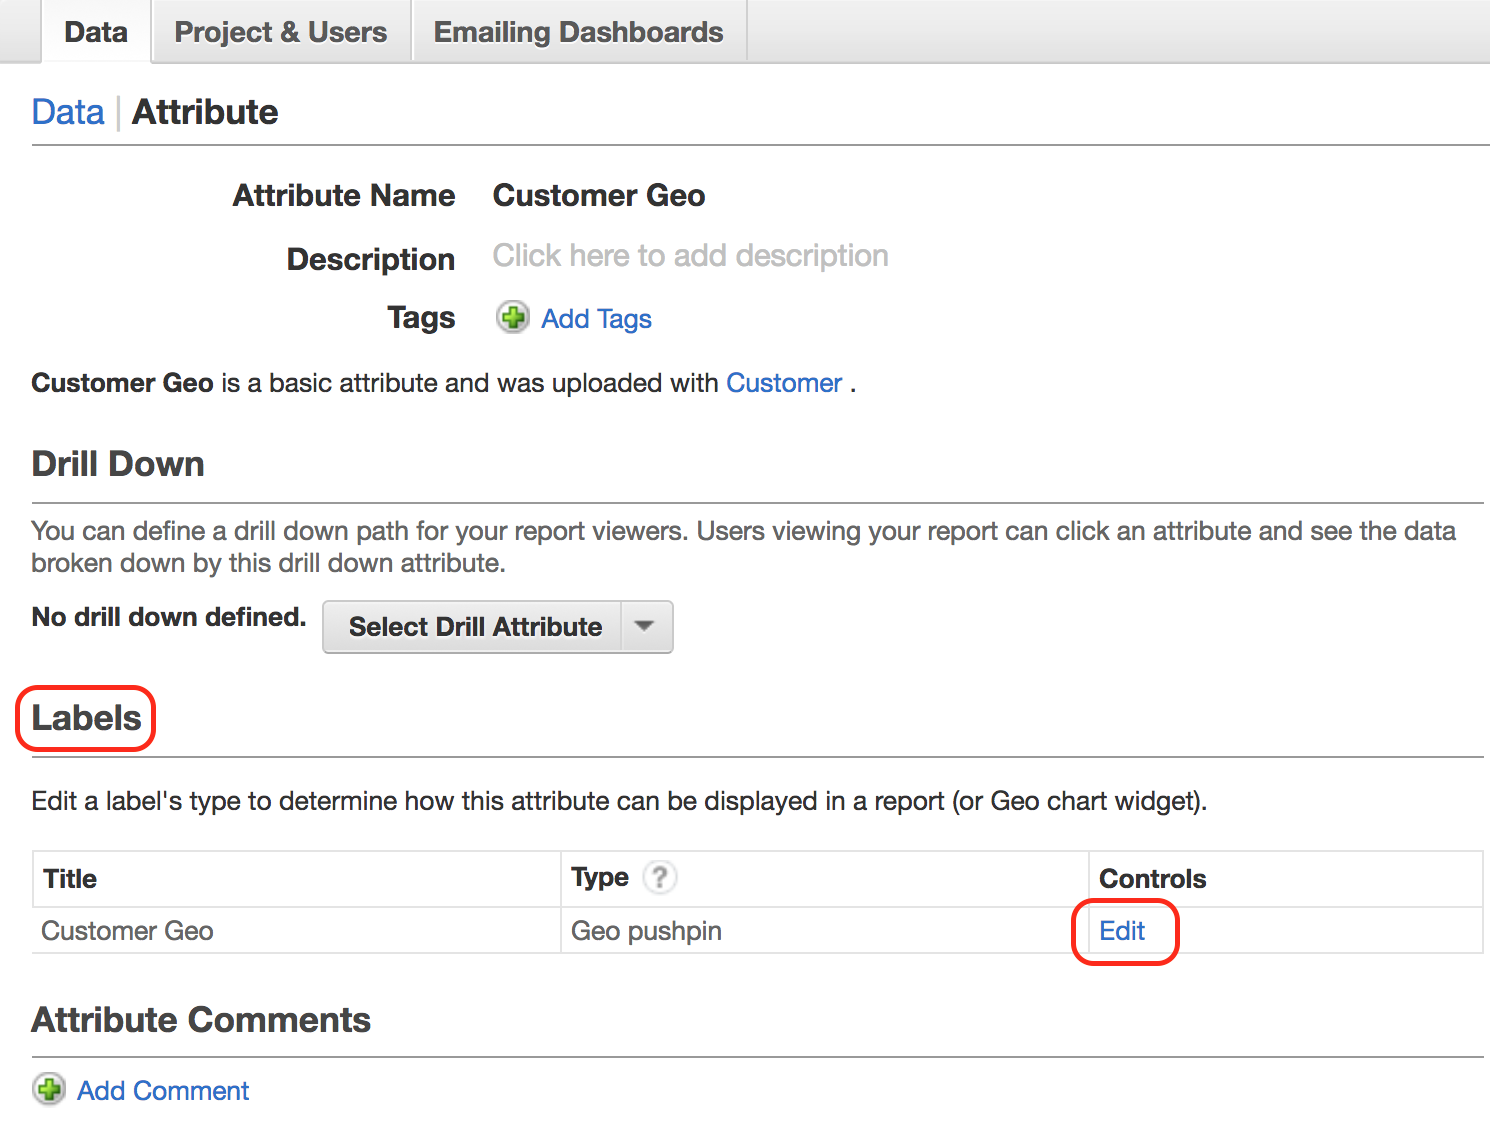
- Select the regional attribute. The attribute information page opens.
- In the Labels section, click Edit for the label that you have added. Label information opens for editing.
- In the Type dropdown, select the geo type for the label:
If you are using geo regions, select the type corresponding to the type of the region that you have in your data.
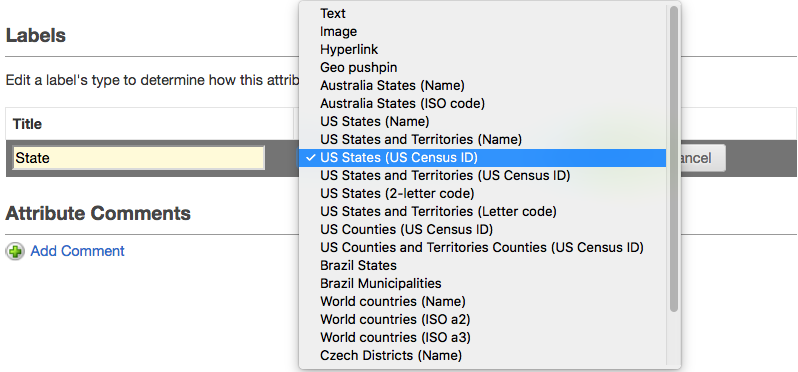
If you are using geo pushpins, select Geo pushpin.
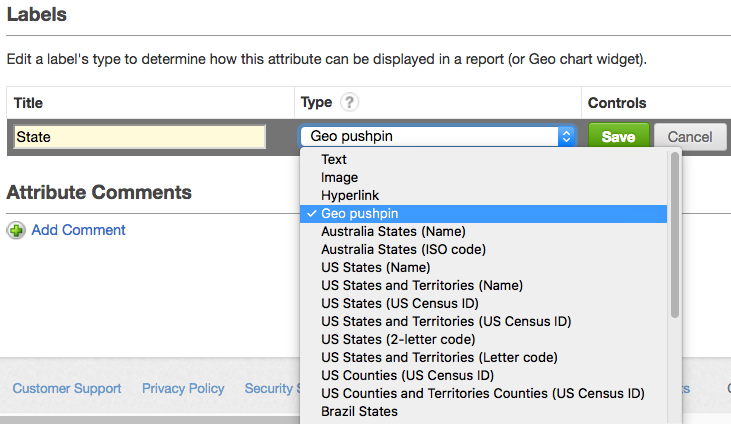
- Click Save. The label type is set.
You are now ready to create geo chart widgets on your dashboards. For more information, see Building a Geo Chart.
TIP: Display a Meaningful Name for Geo Pushpins
When you are using geo pushpins, you may want to display a meaningful name for a location instead of the coordinates. For example, if you define a set of pushpins to retail stores, you may want to see the store names instead of their latitudes and longitudes.
Steps:
- In CloudConnect, add another label to your regional attribute (follow the same steps as described here). In your project data, this attribute should contain the names that you want to see instead of the coordinates.
- Make this label default for the attribute:
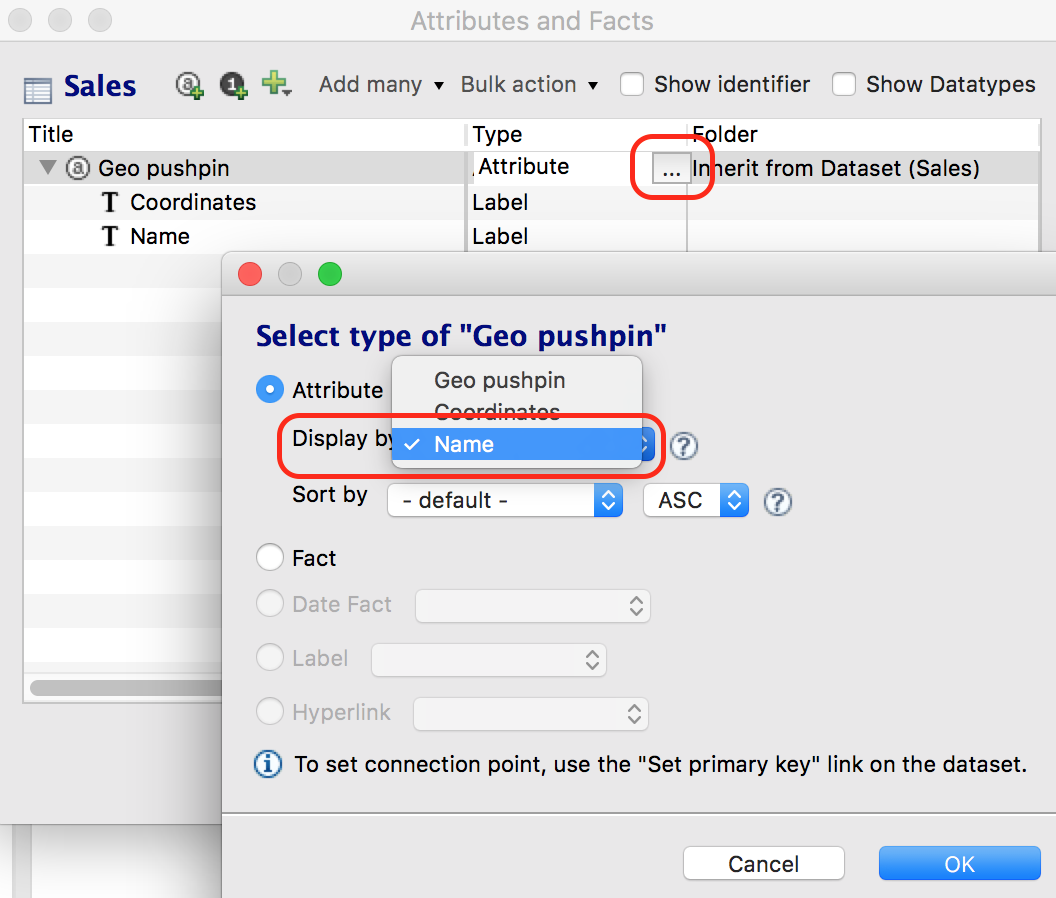
- Publish the data model. For the detailed instruction on publishing, see Publish Your Logical Data Model in CloudConnect.
- Log in to the GoodData Portal, and set the type of the label to Geo pushpin (follow the same steps as described here). The names will now appear for pushpin locations instead of coordinates.